
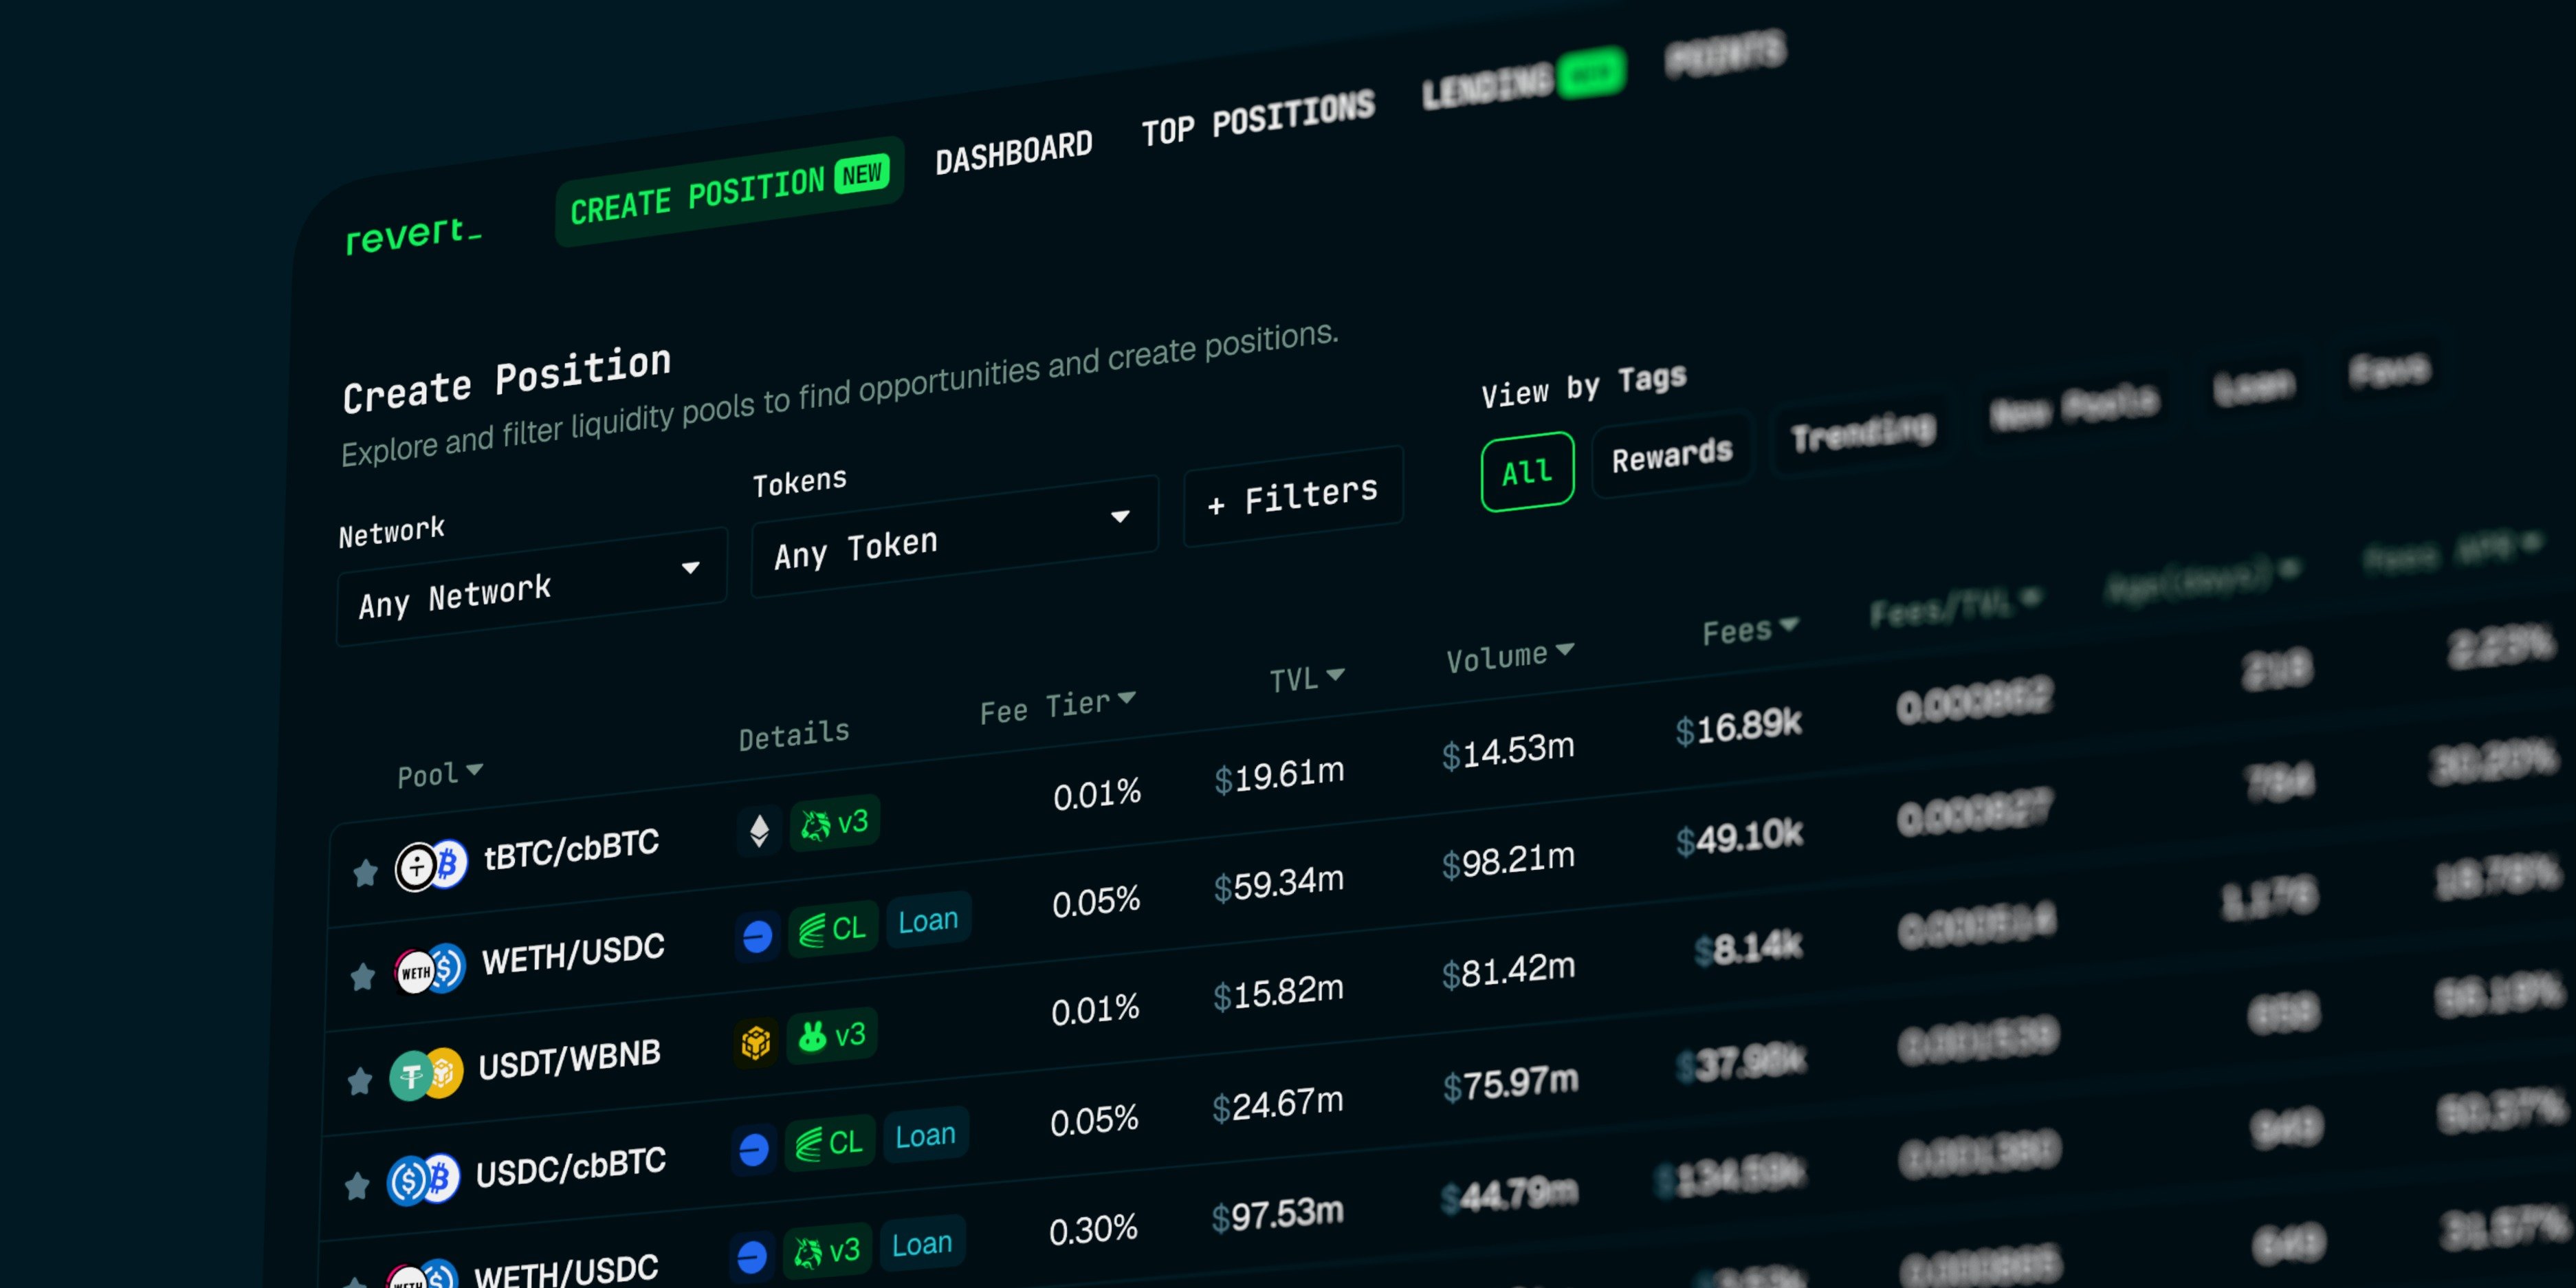
Being a DeFi user means dealing with a constant barrage of data. We're perpetually trying to process these metrics and make sense of the math behind them. For most apps and protocols, the solution for presenting this information seems simple: just show the numbers. But the reality of designing these interfaces is far more complex. Effective data presentation means users can easily digest the numbers, understand the relationships between them, and make better decisions with minimal cognitive load.
Revert Finance's "Discover" page is a prime example of this data density. In this case study, I break down the major UX flaws buried within its massive data table and offer my solutions for a cleaner, more intuitive user experience.
When I first encountered Revert's positions page—arguably the most critical screen in their app—the friction was immediate. Sure, the UI is on-brand and aesthetically pleasing. But to evaluate a single liquidity pool, I found myself pausing, reading each row slowly from left to right, and mentally assembling the context before I could make up my mind about the pool information. It felt like a lot of work.
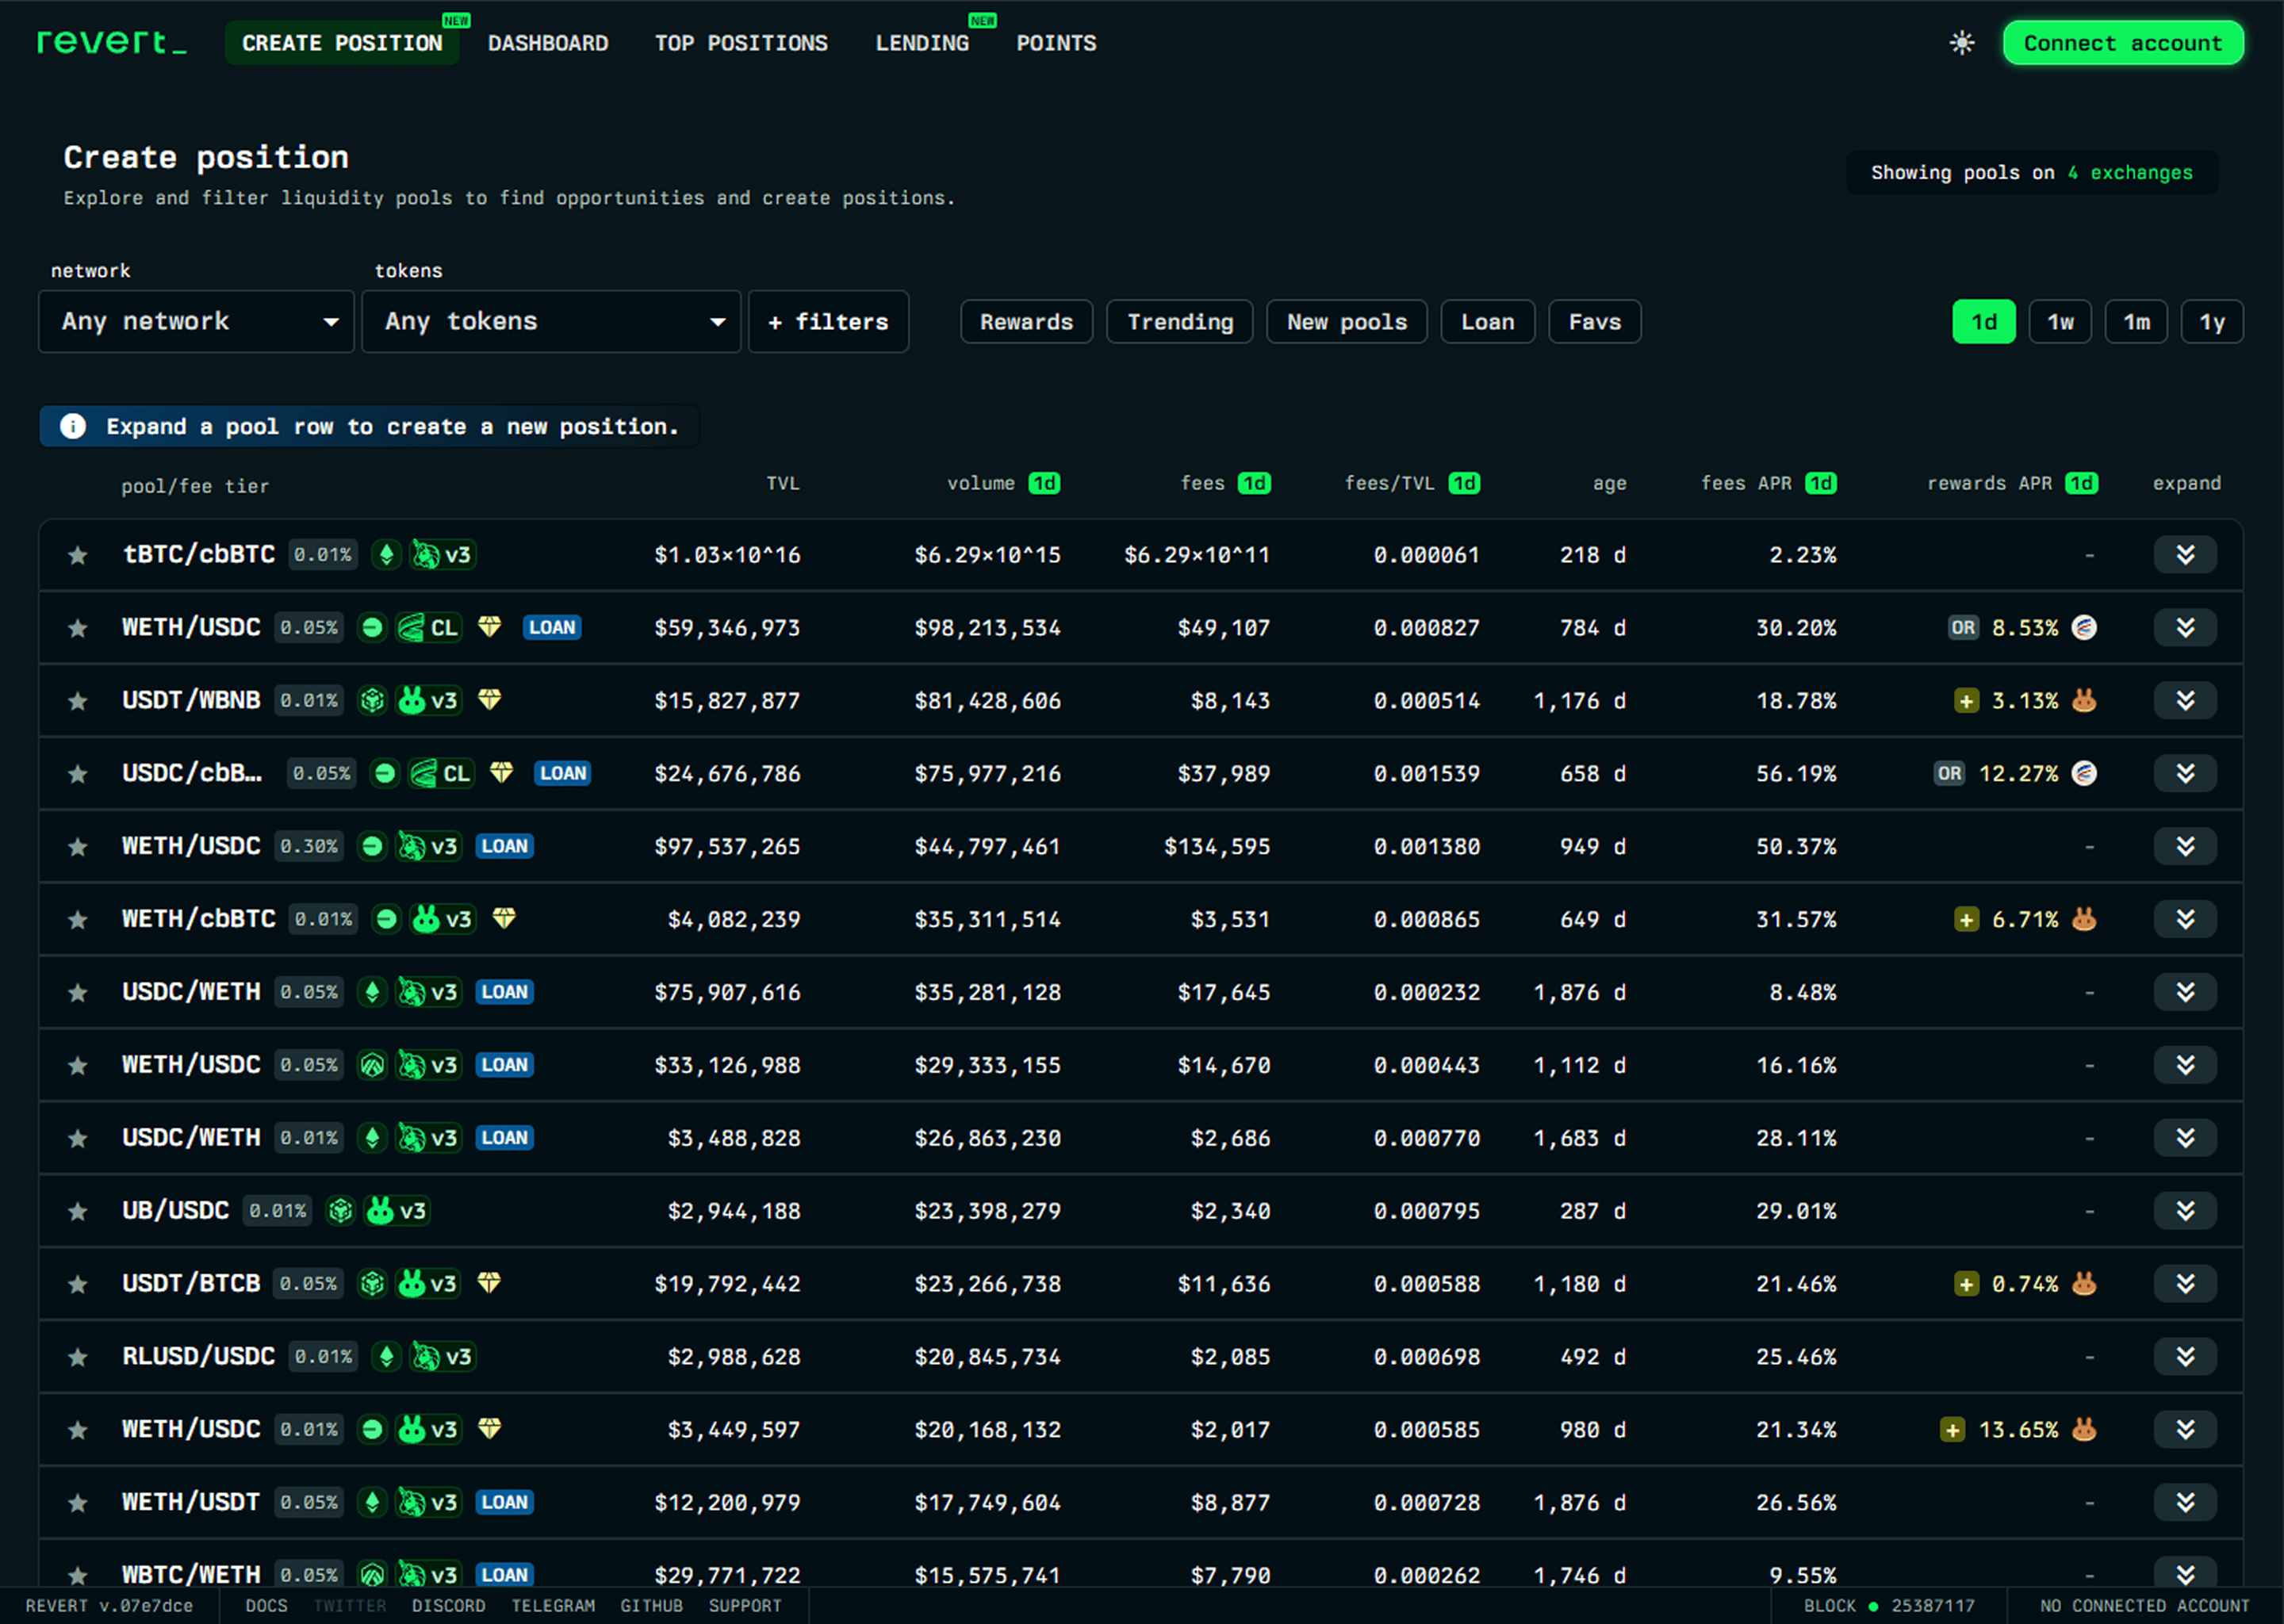
After dissecting the content of this page, I found the main culprits making this screen so difficult to scan:
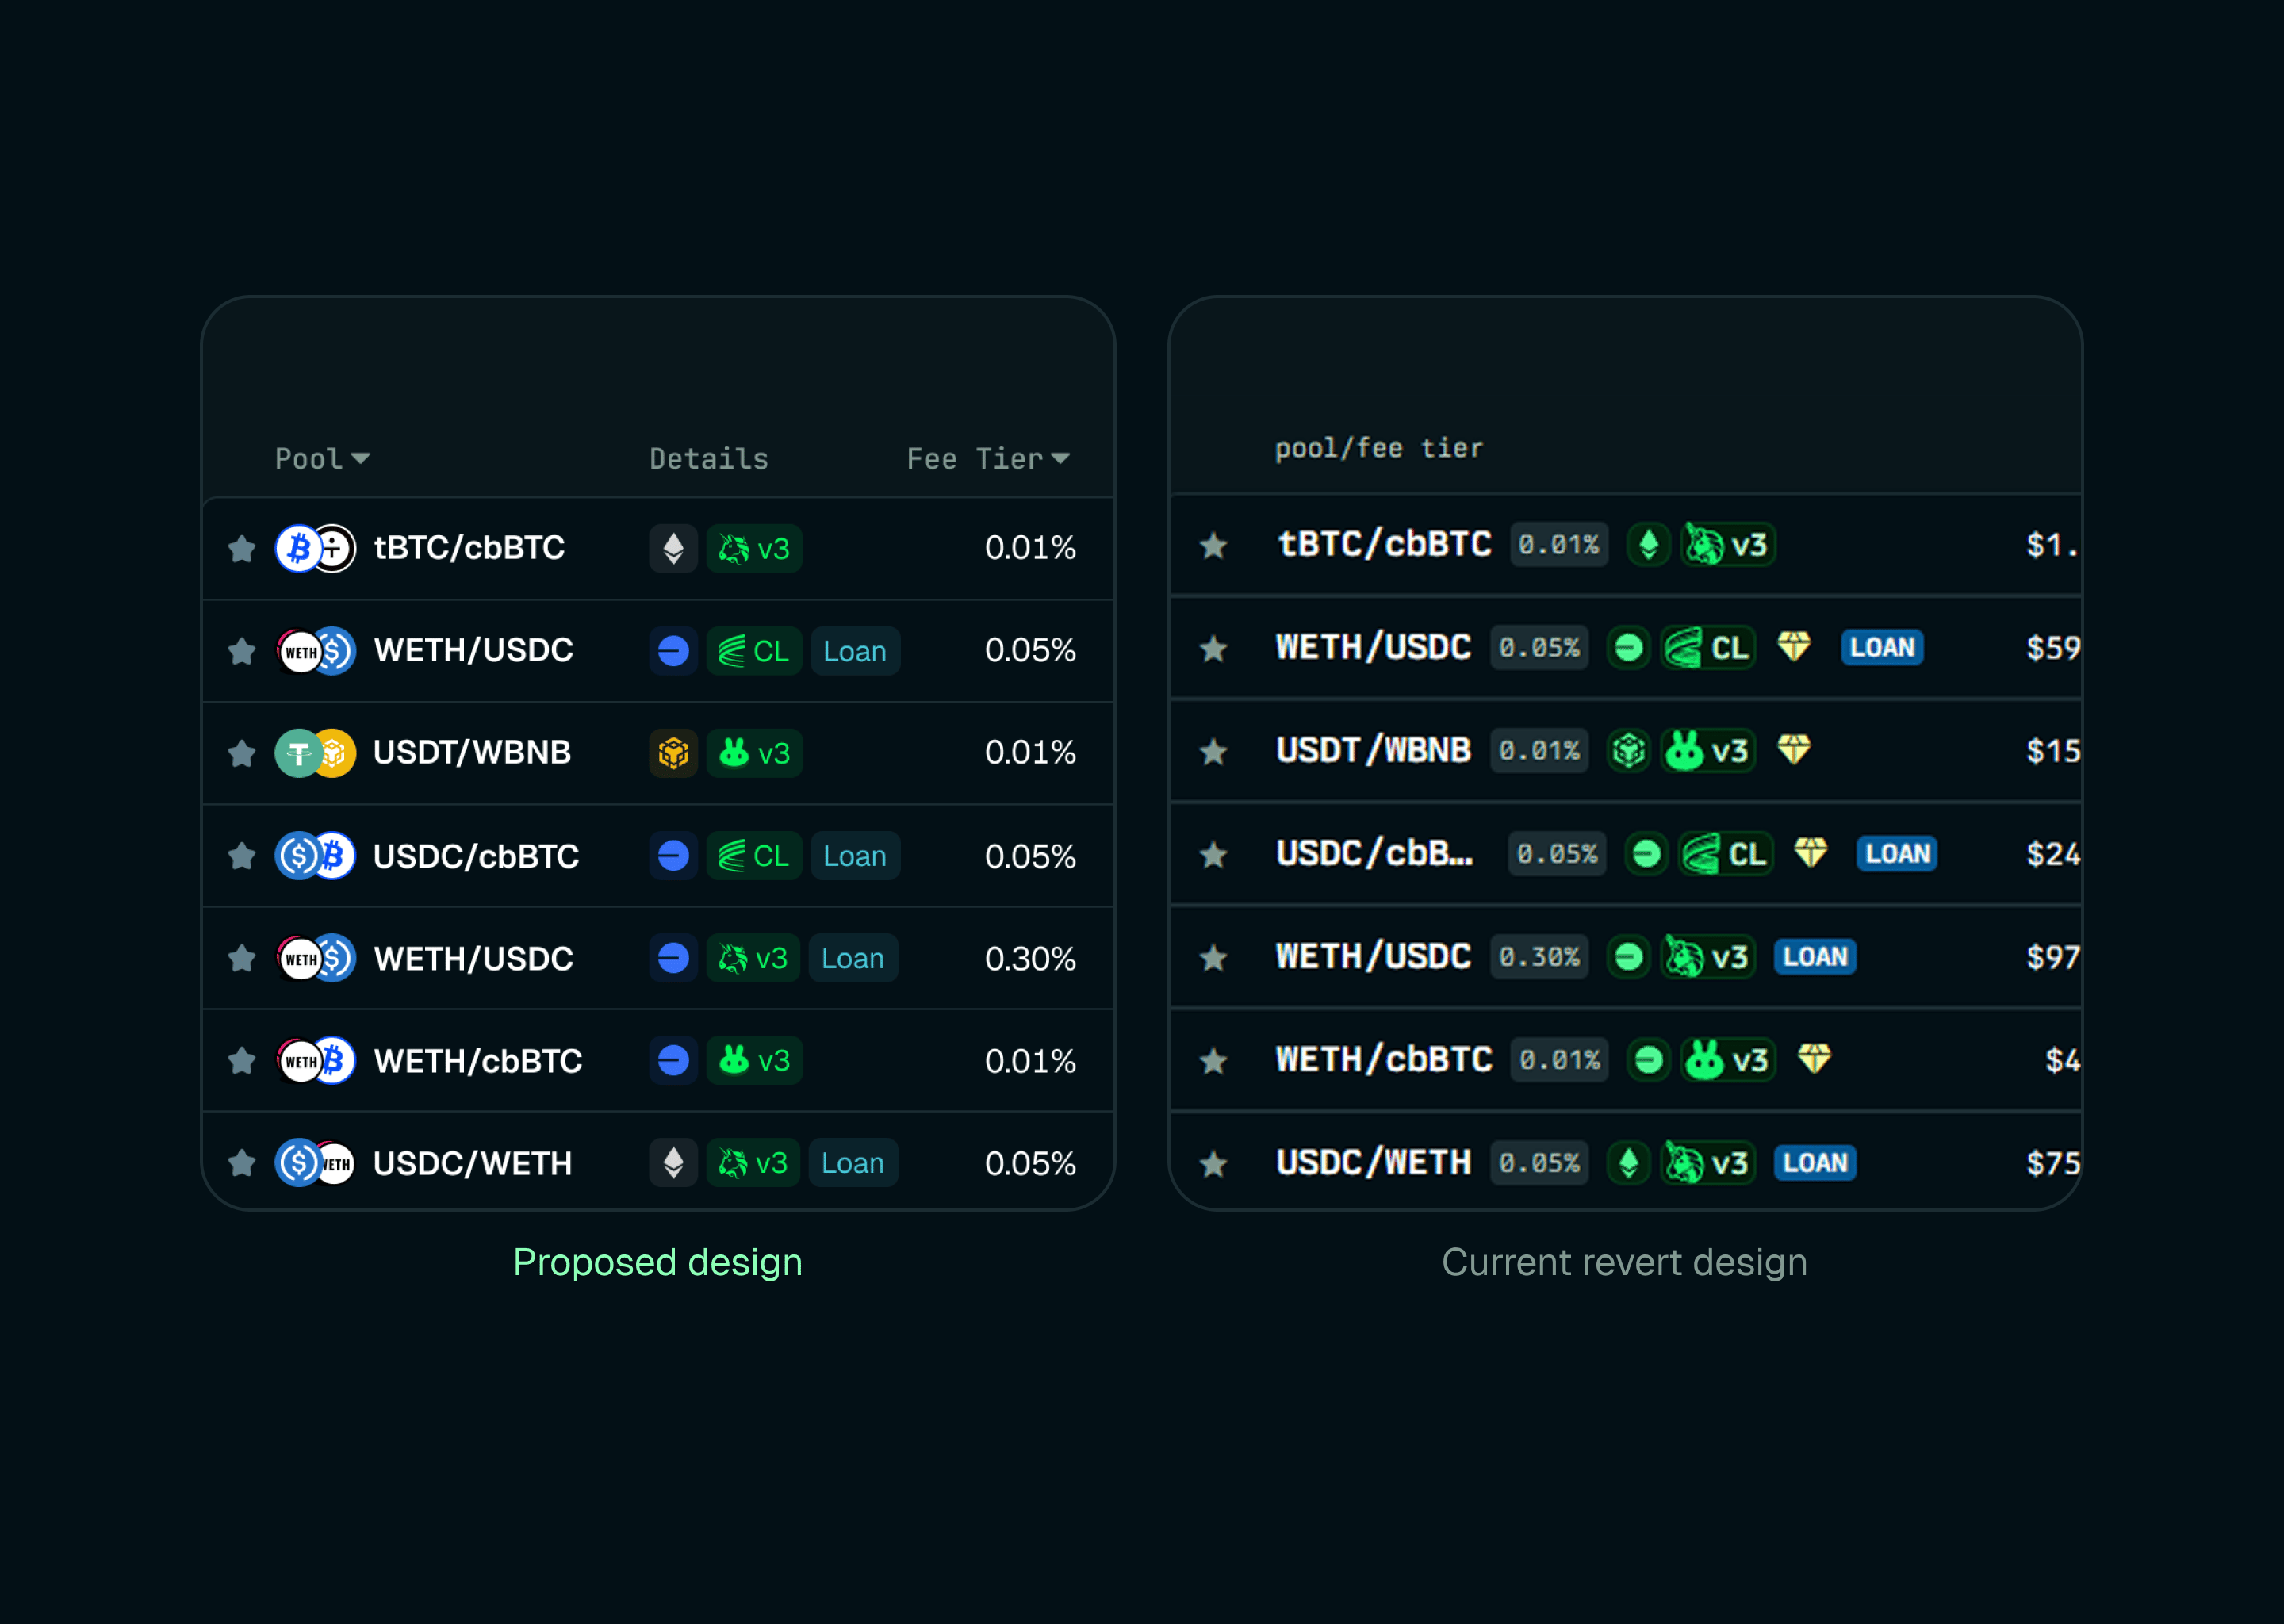
There is a missed opportunity to use token icons, which are significantly faster to recognize at a glance than raw text.
Too many disparate pieces of data are crammed into the first column.
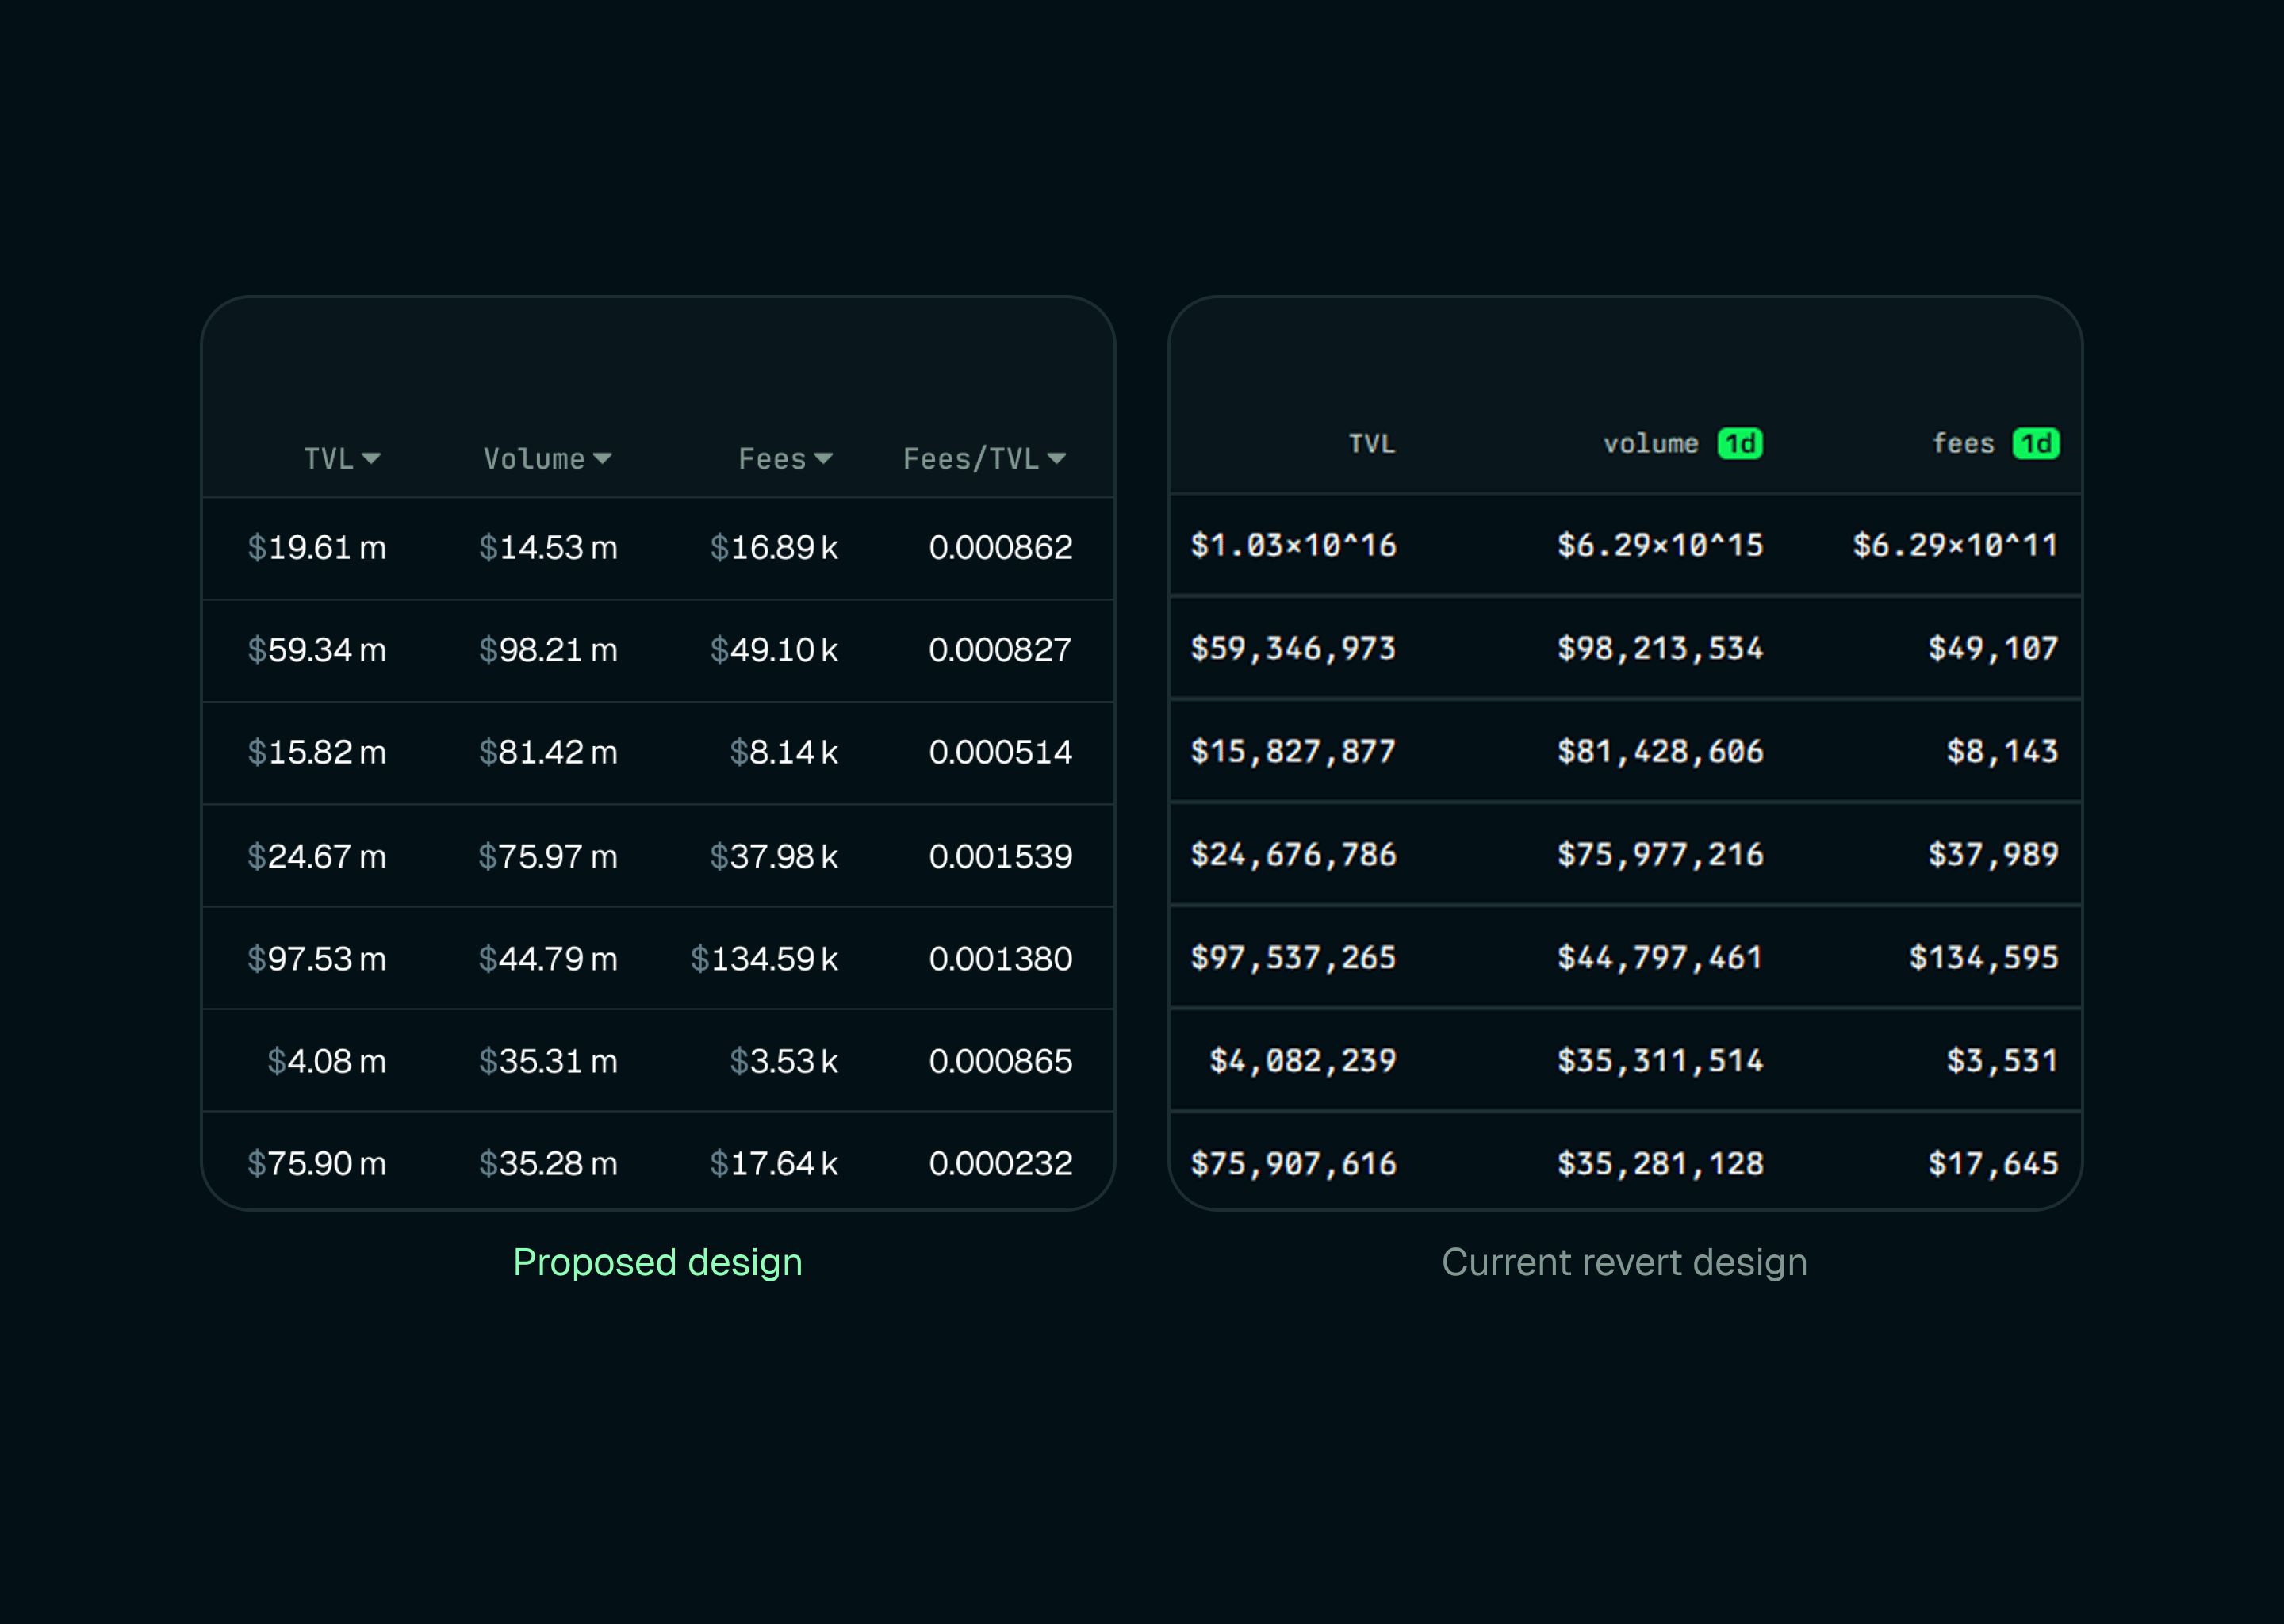
TVL, volume, and fee metrics are written out in full (e.g., $59,346,973), creating unnecessary visual noise when standard financial abbreviations (m, k) would be much faster to scan.
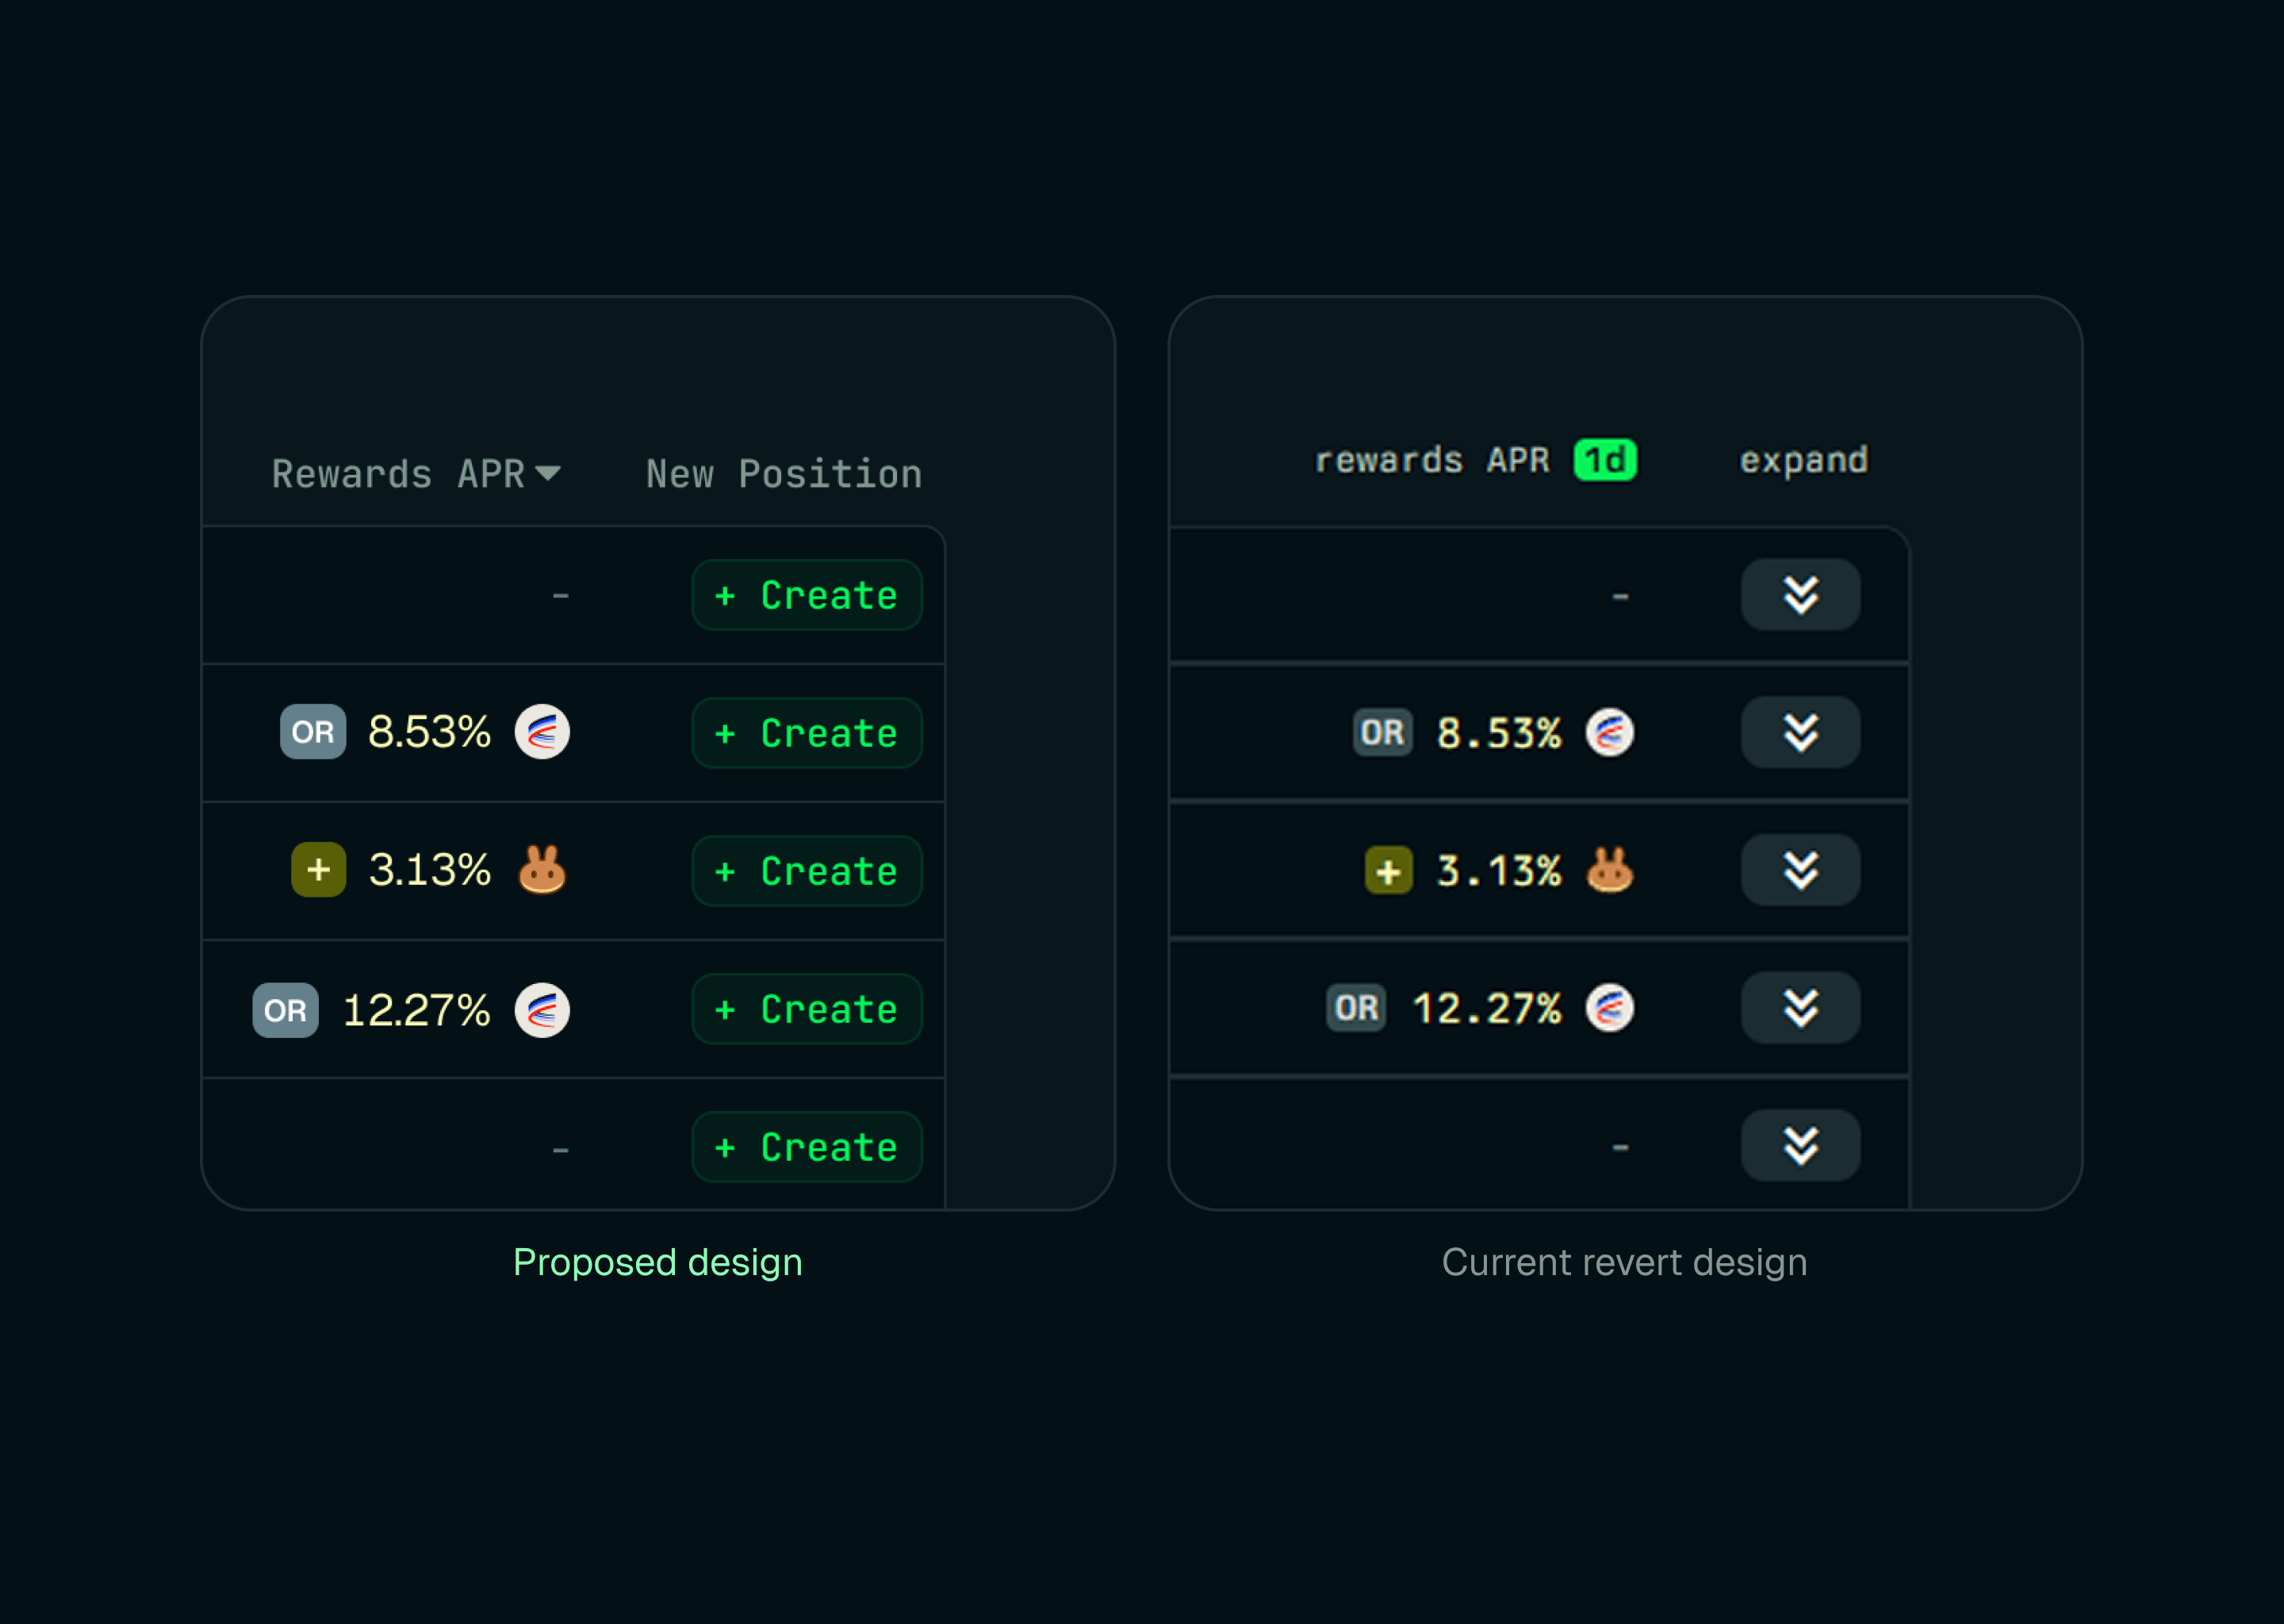
The "expand" action isn't self-explanatory once users scroll down past the table controllers.
The font size is too small, and the typeface choice occasionally hinders scannability.
Now that we have the problems laid out, let's talk about how I approached fixing these issues.
Anyone who has spent even a week in DeFi is familiar with standard token icons—especially for majors like stables, ETH, and BTC. We don't really read "USDC" or "WETH" letter by letter anymore; we just recognize the logo instantly.
It's a basic fact of UI design that visual cues are much faster to scan than plain text. By simply dropping the token icons right next to the pool tickers, we use that familiarity as leverage, immediately cutting out friction and making it much easier to spot the right asset pair.
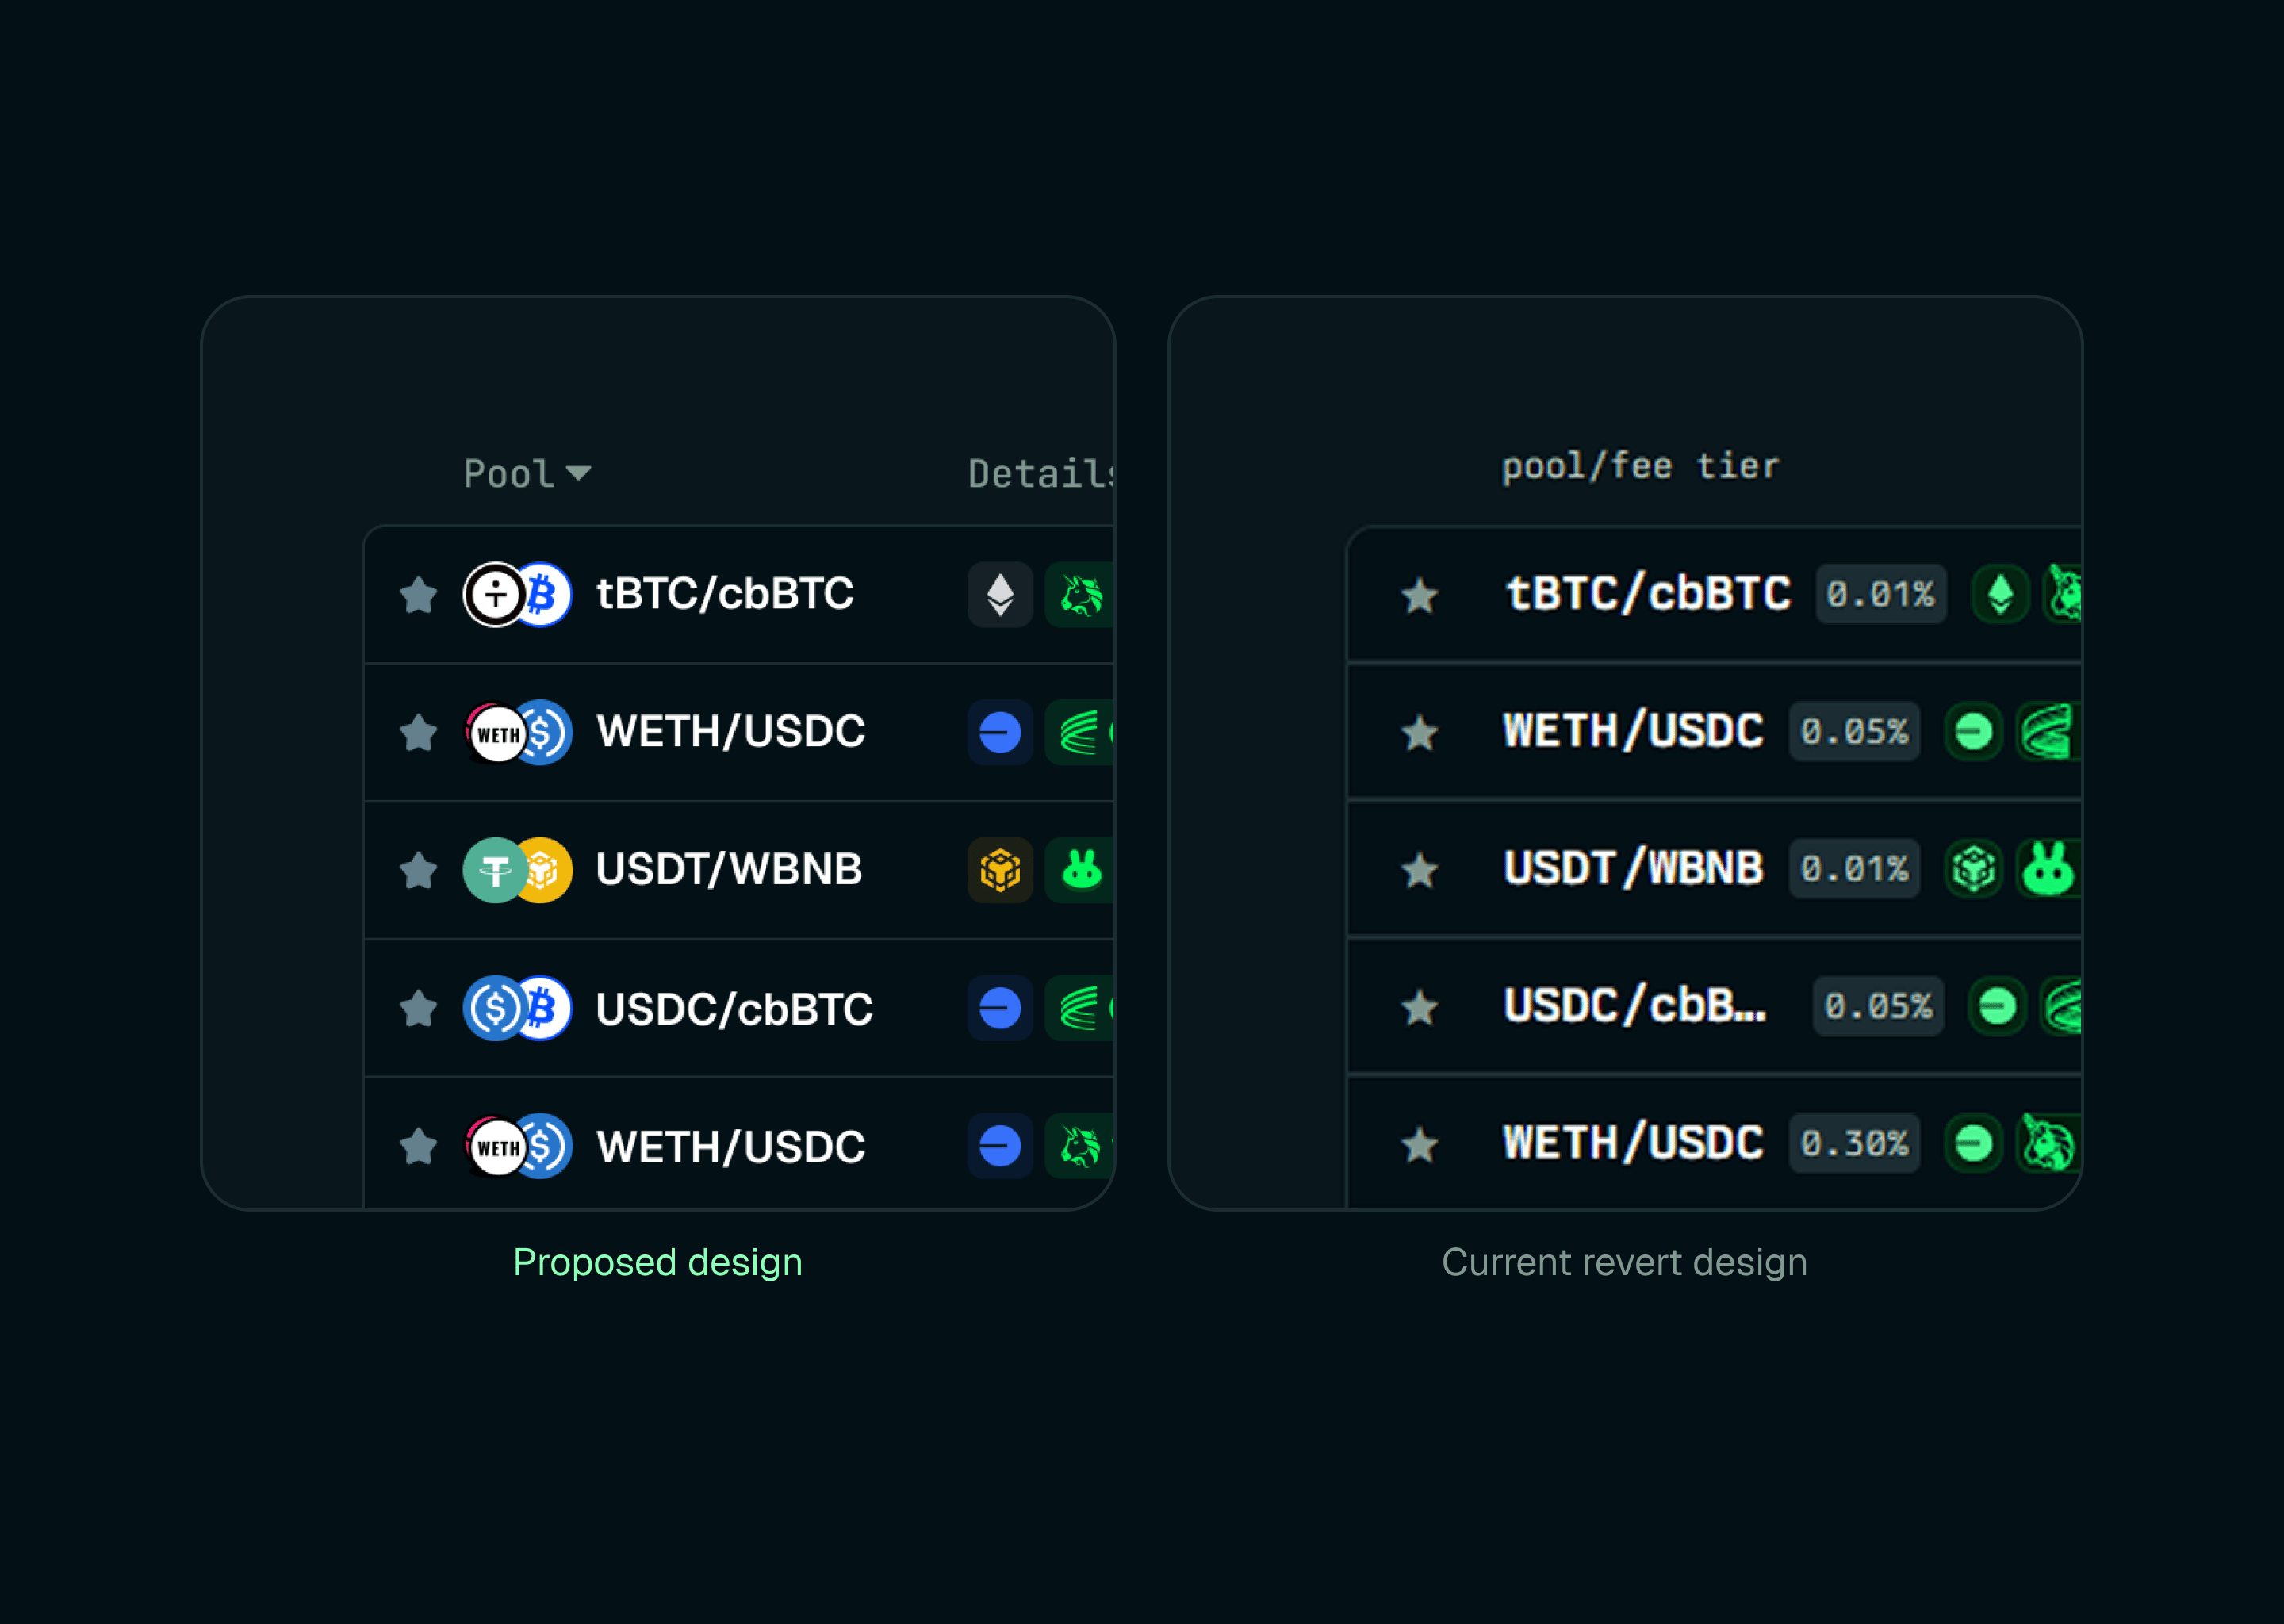
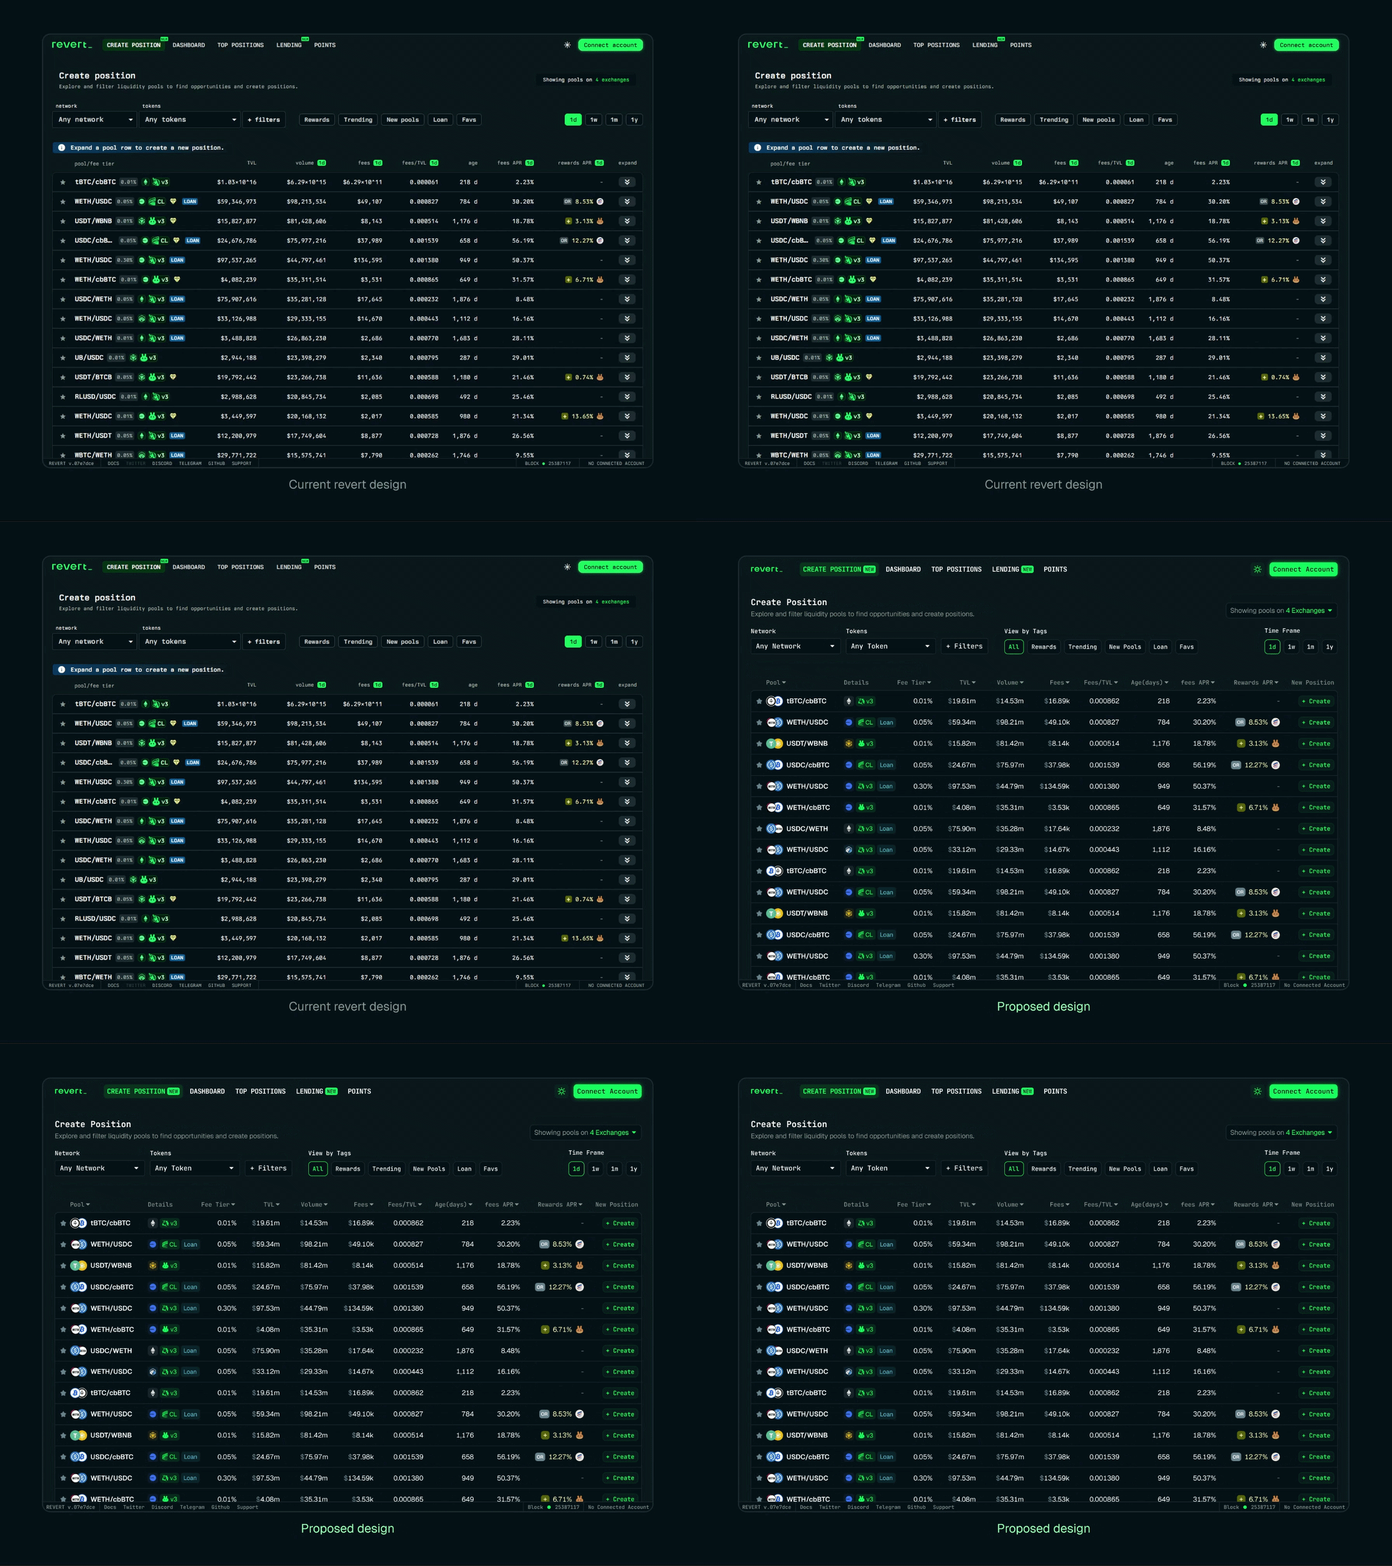
The first column of the pools table is doing way too much heavy lifting. It crams together the pool pair, fee tier, network, protocol, reward indicator, and loan tag into a single space. Smashing all these data points together makes it unnecessarily hard to scan for specific details. This is especially true for the fee tier, which is a critical piece of information for users.
To fix this, I broke that single overloaded column into three distinct ones:
Pool: The token pair and their icons.
Details: Secondary tags, including the network, protocol version, and loan indicators.
Fee Tier: Isolated completely so it can be read at a glance.
When evaluating a liquidity pool, nobody needs to see the TVL, volume, or fees calculated down to the exact dollar or cent. For the most part, users just want a quick pulse check: Is there enough liquidity here, and is the pool actively being traded on?
We can drastically clean up the UI by abbreviating these massive numbers with commonly used suffixes (like "m" or "k") and capping them at two decimal places (the only exception being the Fees/TVL column). These shorter values still give users all the data they need, while making it infinitely easier to compare different pools at a glance.
Downward chevrons at the end of each row don't tell much about their function in the current design. While it is mentioned that users can create new positions by expanding each row, it's best to use self-explanatory CTAs to avoid any confusion.
Revert currently uses Berkeley Mono as its sole typeface. While monospaced fonts are generally a solid choice for data-heavy interfaces, pairing a small font size with heavy font weights actually creates a dense UI that is difficult to scan.
I swapped this out for a lighter weight of the Geist typeface, while specifically keeping the numbers tabular so the digits continue to align perfectly on the vertical axis for easy comparison. Geist also has a more efficient footprint, which naturally gives the rows much-needed breathing room—especially on smaller screens.
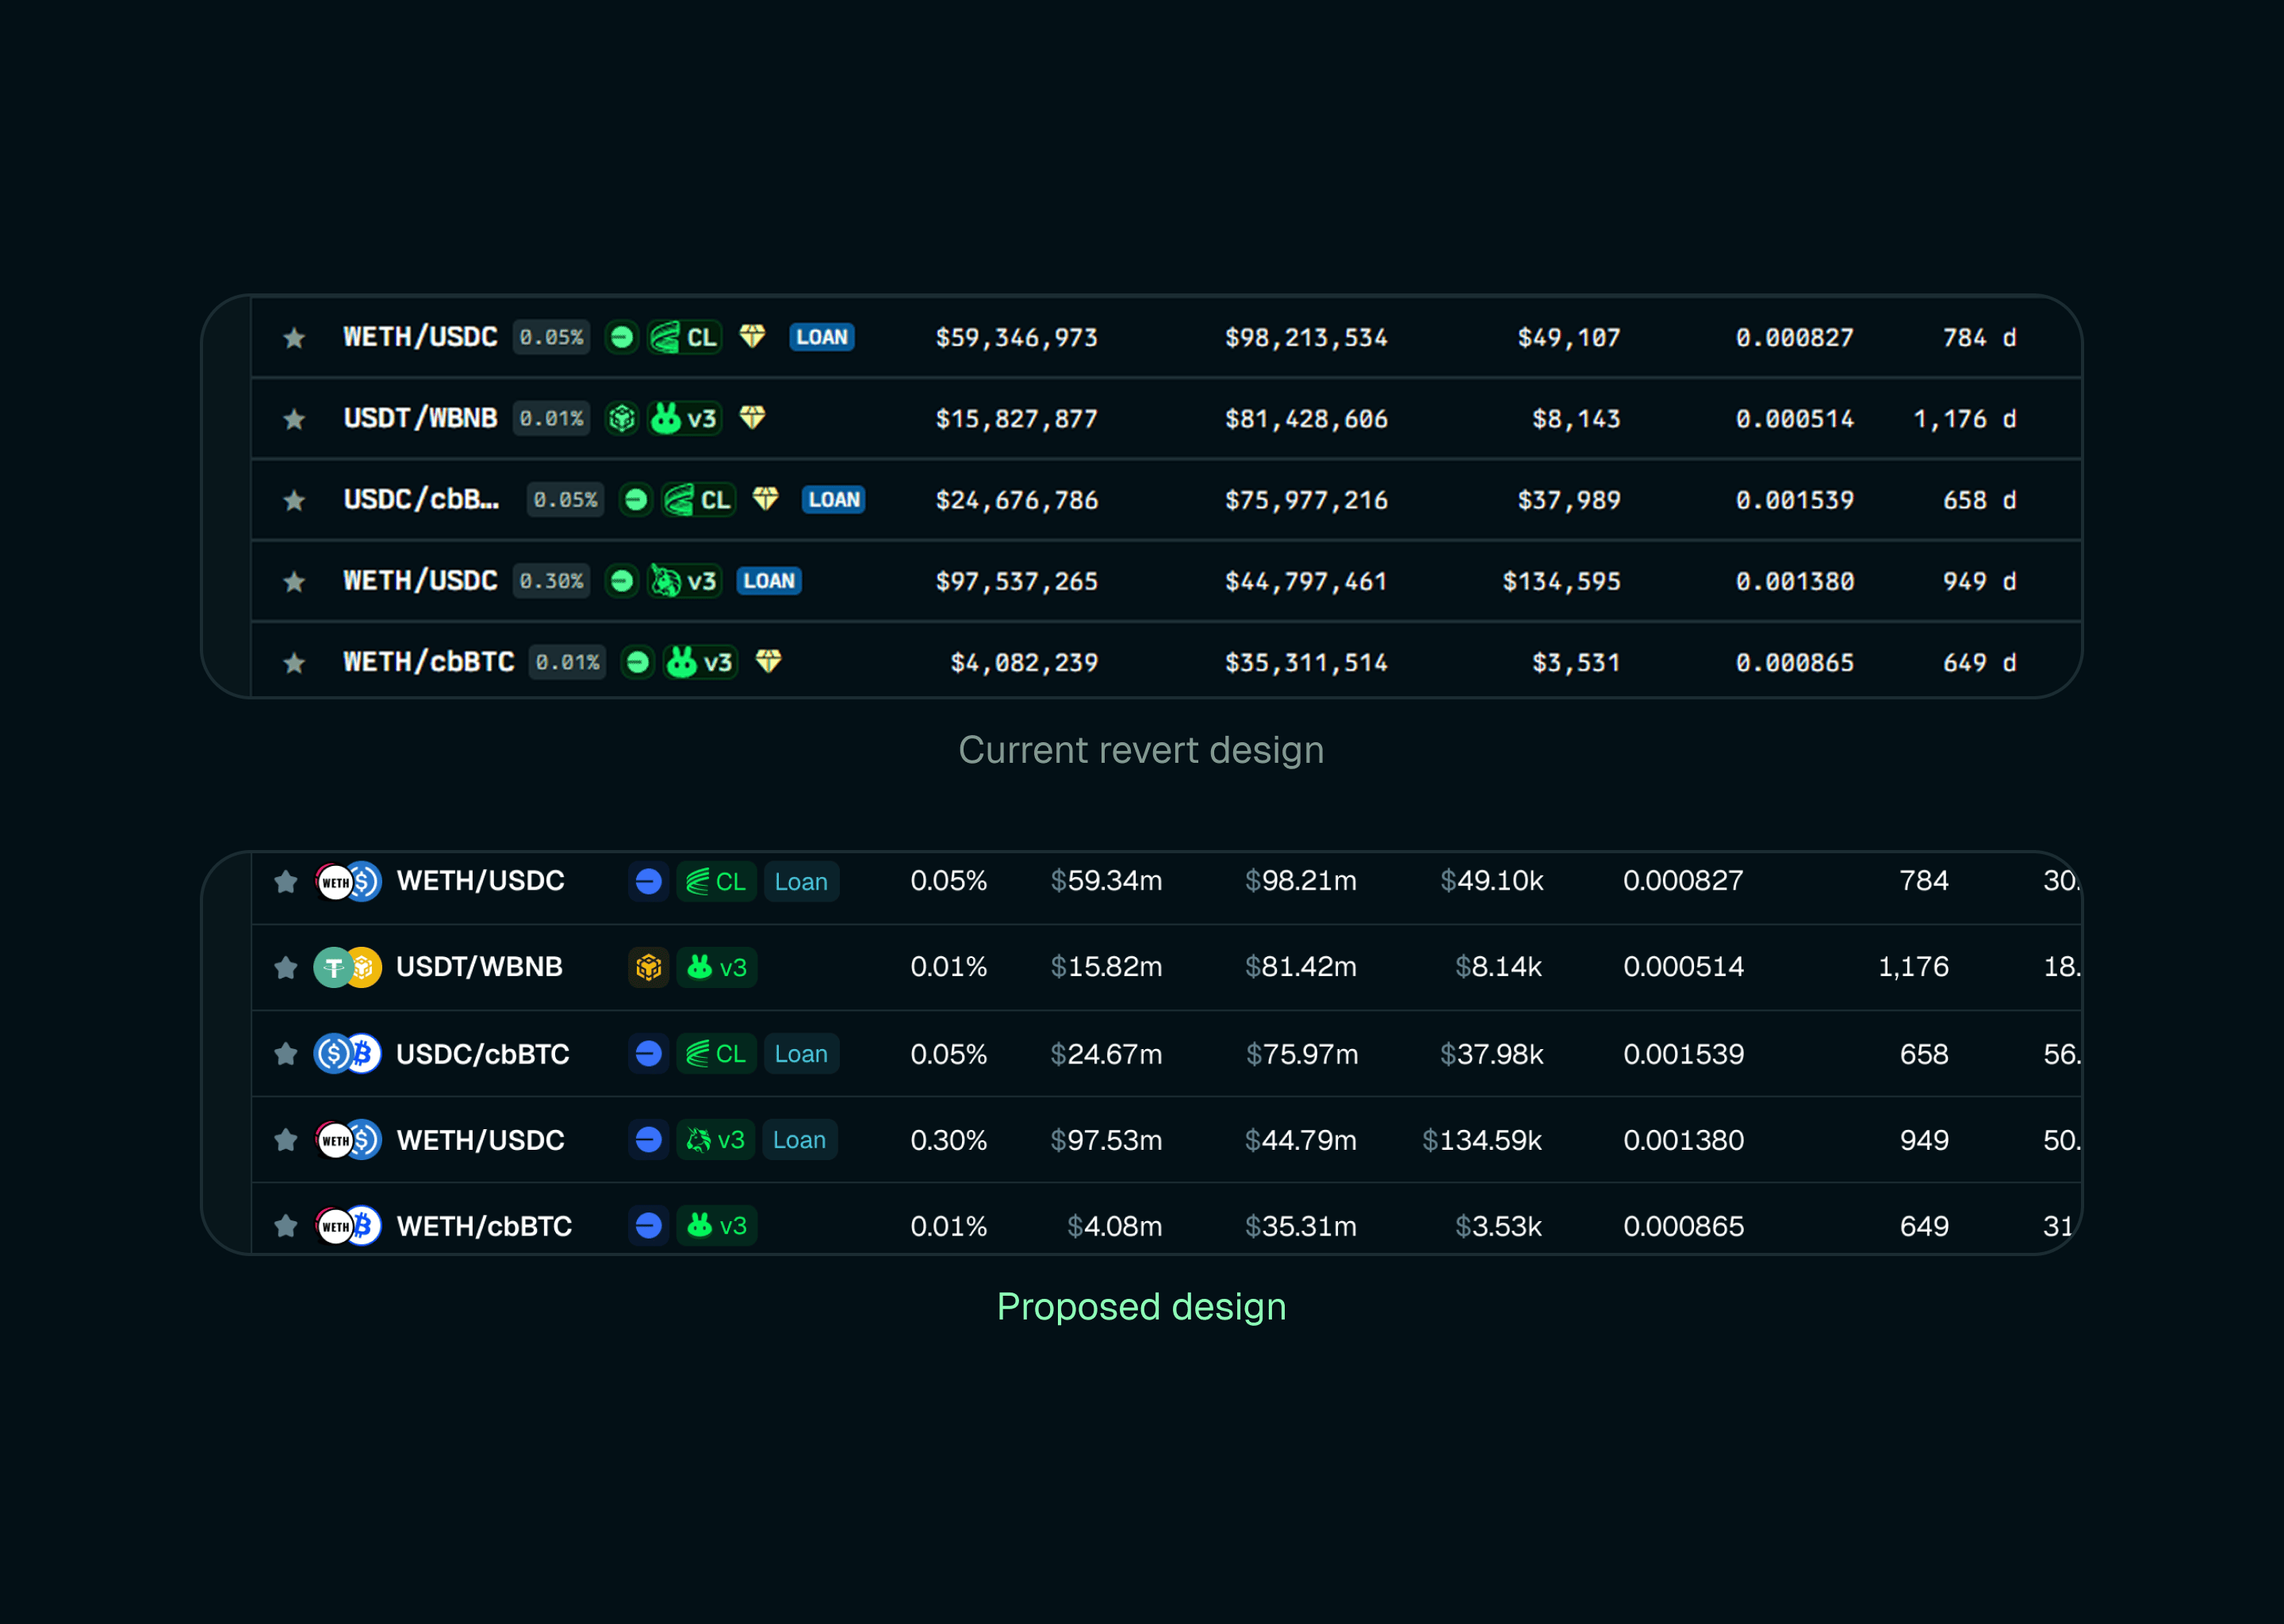
Information only exists to support decision-making. The easier the data is to digest, the faster users can confidently take action. In this redesign, my primary goal was to untangle the visual hierarchy so users spend less time decoding the interface and more time taking action.
Here are the final results of my work compared to the existing design:
If you made it all the way down here, thank you. I share more insights like this on my Twitter, so make sure to follow me for more in-depth UX dives and design breakdowns!