Manoj Kumar Desai | MconnectDAO.eth | DAO Researcher | Web3 Governance collaboration with ChainSights API (chainsights.one)
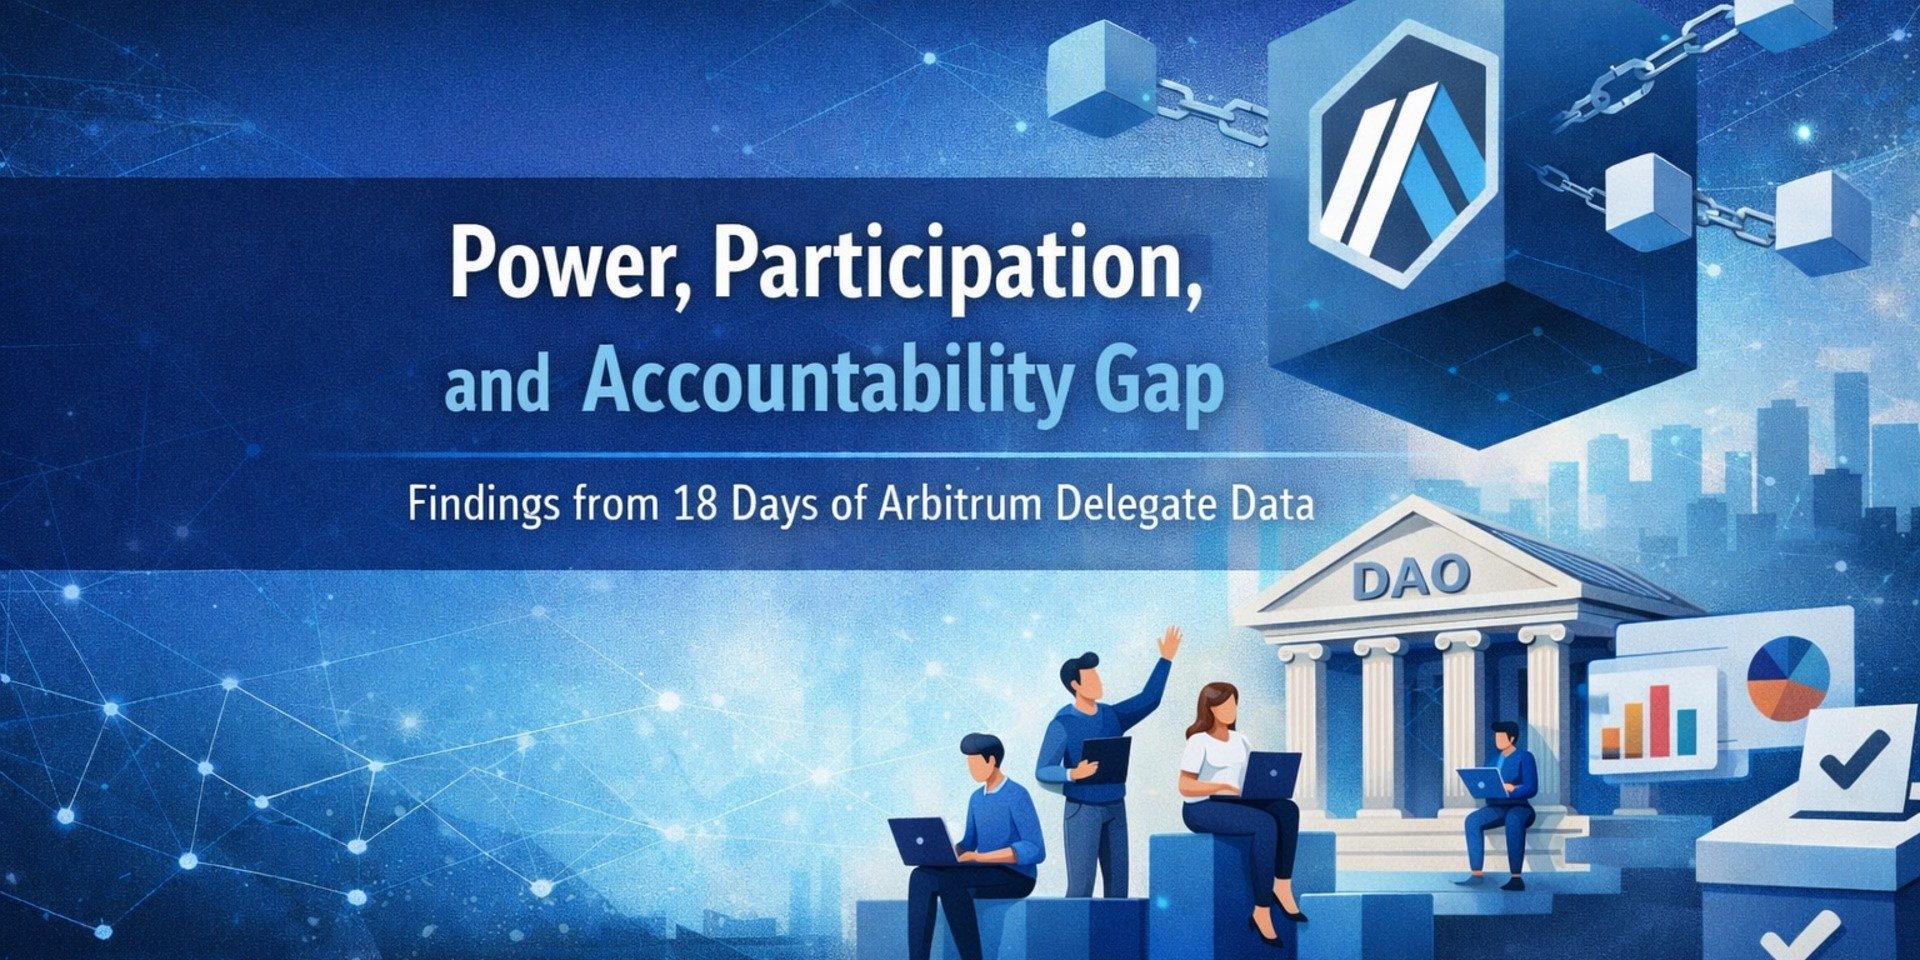
This analysis draws from 18 daily snapshots of Arbitrum's top 100 delegates by voting power, covering March 25 to April 14, 2026. The dataset, sourced via the ChainSights API, tracks delegated ARB, delegator counts, daily rankings, and tier classifications across the observation period. Three patterns emerged that deserve serious attention from anyone who cares about how Arbitrum governance actually functions.
Entropy Advisors holds ~32 million ARB at Rank 1, supported by just 131 delegators.
This is the most structurally significant data point in the entire dataset. Not because it suggests wrongdoing it doesn't. Entropy Advisors has built genuine credibility in the ecosystem. But the number raises a question that token-weighted governance models rarely ask openly:
What kind of trust produces this concentration..?
The 131 delegators here are almost certainly institutional actors protocols, funds, aligned insiders. Their delegation reflects strategic alignment, not passive participation. That's legitimate governance behavior. But it means Rank 1 in Arbitrum's governance is effectively determined by a very small, very specific trust network.
The question worth asking: Who is structurally excluded from that network, and does the DAO have visibility into that exclusion?
olimpio.eth has 36,097 delegators. Camelot has 10,331. Both sit below delegates with far fewer supporters but higher-value wallets.
This is the accountability asymmetry at the core of token-weighted governance and the data makes it unusually visible.
In a delegator-count model, olimpio.eth would be a top-tier governance actor. In ARB-weighted governance, their actual influence is significantly diluted. Neither model is inherently correct. But the gap reveals something important: delegators from smaller wallets are participating. They are making active choices. Their contribution to the legitimacy of a delegate's mandate is real but their contribution to actual voting outcomes is marginal.
Key insight: 36,097 people whose collective governance weight is outweighed by a handful of institutional wallets. That gap deserves to be named, tracked, and discussed not assumed away.
Across the 18-day window, T1 delegate rankings showed minimal movement. The top positions held.
Rank stability can indicate two very different things:
Consistent high performance, or
A structural barrier to entry that makes displacement nearly impossible regardless of performance
The data alone cannot distinguish between these. But 18 days of near-zero movement at the top tier combined with the capital concentration above points toward the latter being at least a contributing factor.
Practical implication: New delegates face compounding disadvantages: lower visibility, lower inbound trust, lower proposal influence. The gap between T1 and emerging delegates widens over time.
This dataset is rigorous on structural metrics. It does not measure:
Whether delegates read proposals before voting
Whether voting patterns reflect independent judgment or protocol alignment
Whether deliberation quality varies across tiers
These are the accountability questions that matter most. They require qualitative methods beyond snapshot data. Governance accountability needs both: the quantitative map, and the qualitative walk through it.
The findings point to a governance system that is structurally stable but not structurally open:
Power concentrates in technically functional but interrogable ways
Participation is broad by delegator count but narrow by influence
The top tier shows little competitive pressure
None of this is a crisis. But left unexamined, these conditions tend to calcify over time.
Purpose of this study: Make these patterns visible. What the community does next is a governance question.
The simplest confirmation: in token-weighted governance, who holds the tokens matters more than how many people participate.
That's not neutral. It's a design choice with real consequences for who governance works for and who it works around.
Tracking it is the first step.
Part 3 will examine voting behavior patterns and proposal-level participation across delegate tiers.
FieldDetailSourceChainSights API (chainsights.one) PeriodMarch 25 – April 14, 2026 (18 daily snapshots)Delegates TrackedTop 100 by voting power (Arbitrum DAO)Prepared byManoj Kumar Desai Arbitrum Delegate Accountability Study, Part 2GeneratedApril 14, 2026
Sheets:
Raw Data — Full longitudinal dataset
Delegate Summary — Aggregated stats per delegate
VP Trend — Voting power over time (pivot)
Rank Changes — Daily rank per delegate
Key Metrics:
votes_arb — Delegated ARB voting power
delegators_count — Number of wallets delegating
rank — Daily rank by voting power (1 = highest)
weight_tier — T1 = Top 10 | T2 = Ranks 11–50 | T3 = Ranks 51–100