
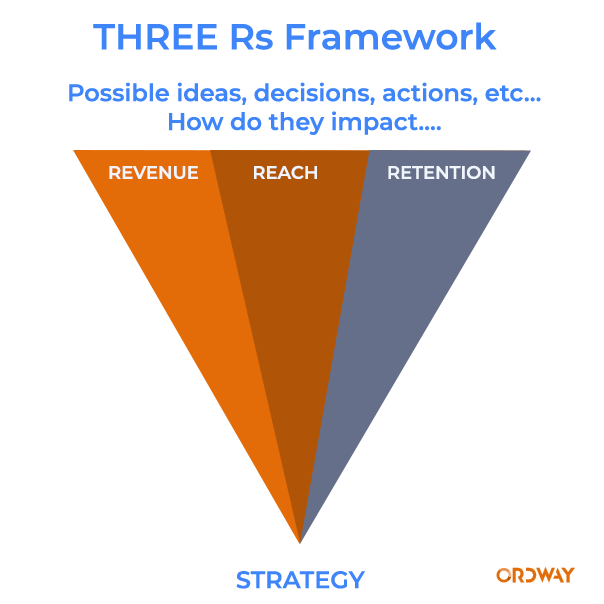
In the dynamic landscape of blockchain technology, scaling solutions have become a pivotal focus, particularly for Ethereum. Among these solutions, Optimism and Arbitrum have emerged as significant players, each striving to enhance transaction speed, reduce costs, and ultimately, improve the user experience. These Layer 2 solutions utilize Optimistic Rollups to achieve their goals, but each has its unique approach and features. This article aims to delve into a comparative analysis of these two platforms, focusing on three critical parameters: Reach, Retention, and Revenue. These parameters serve as key indicators of a platform's growth, user engagement, and financial viability, providing a comprehensive perspective on their performance and potential impact on the future of blockchain technology.
Optimism dashboard
https://www.covalenthq.com/platform/increment/#/pages/sandesh/optimism/
Arbitrum dashboard
https://www.covalenthq.com/platform/increment/#/pages/sandesh/arbitrum/
To understand the nuances of Optimism and Arbitrum's performance, we will be examining a range of data points under each of the 3Rs. For Reach, we'll look at trends in the number of transactions, the influx of new users, transactions per second, and the transaction share from Decentralized Exchanges (DEXs) and Non-Fungible Tokens (NFTs). Retention will be assessed through the stickiness ratio, days active per user, the trend of new vs. existing users, and the monthly cohort retention rate. Lastly, for Revenue, we'll analyze the gas fees paid, traded volume, and gas paid per user. Each of these data points offers valuable insights into the platforms' current performance and potential trajectory, laying the groundwork for a robust comparison.
](https://img.paragraph.com/cdn-cgi/image/format=auto,width=3840,quality=85/https://storage.googleapis.com/papyrus_images/e7fb4a91a25bcc8aeb8cbfce5423173f687248d4a7731cf16fe258f8f304c12f.png)
Understanding where growth comes from and how to create it, is paramount to product success. So In this section, we'll explore the reach of Optimism and Arbitrum, focusing on key metrics like transaction trends, user influx, and transaction share from DEXs and NFTs. These data points will help us understand the extent of each platform's adoption and their potential for future growth.

The reach metrics reveal some interesting trends between Arbitrum and Optimism. Notably, Arbitrum has a significantly higher social media reach than Optimism, with a larger presence on both Twitter and Discord. This suggests that Arbitrum's messaging and community engagement strategies may be more effective, contributing to its broader reach.

In terms of transaction volume, Arbitrum is leading the race, processing almost three times as many transactions as Optimism. This dominance appears to be growing, indicating that users may prefer Arbitrum for its performance or user experience.

The influx of new users, or addresses, is booming on both platforms, reflecting the growing interest in Layer 2 solutions. However, Arbitrum is outpacing Optimism in this regard, suggesting that it may be more successful in attracting and onboarding new users.

A closer look at the types of transactions reveals that DeFi is a major area of interest for users on both platforms. However, the share of NFT transactions on Optimism, which peaked at 7-8%, is much smaller on Arbitrum. This suggests that Arbitrum users are particularly interested in DeFi. The success of Arbitrum Nova, a solution specifically designed for DeFi transactions, seems to validate this trend.
In conclusion, while both Optimism and Arbitrum are showing promising growth, Arbitrum appears to be leading in terms of reach. Its stronger social media presence, higher transaction volume, and success in attracting new users, particularly within the DeFi sector, suggest that it may have the edge in this race. However, the landscape of blockchain technology is dynamic, and it will be interesting to see how these trends evolve over time.
Retention rates are a critical measure of a project's health, reflecting the value users find in the blockchain and the effectiveness of the user experience. High retention rates not only enhance the platform's value proposition but also fuel community building and organic growth, making strategies for improving user experience and reducing activation barriers essential for long-term success.
Analyzing the retention metrics for Optimism and Arbitrum reveals some insightful trends. Both platforms have a similar average number of active days per user, with Optimism at 1.14 and Arbitrum slightly higher at 1.17. This suggests that users are engaging with both platforms at a comparable level.

However, the cohort retention rate tells a different story. Optimism sees higher retention in the initial 2-3 months, after which it drops, indicating that users tend to move on after this period. In contrast, Arbitrum's retention rate increases after the initial months, suggesting a higher learning curve but greater user loyalty once this hurdle is overcome. This could imply that while Optimism may be more accessible or appealing to new users, Arbitrum's features or user experience may be more compelling in the long run.

Arbitrum also dominates the new user market and to some extent, the existing user market, indicating a stronger overall retention performance. The stickiness ratio for Optimism, while generally lower than Arbitrum, has been on a concerning downward trend recently. This could signal a decrease in user engagement or satisfaction, which Optimism will need to address to improve its retention rates.

In conclusion, while both platforms demonstrate strengths in different areas of retention, Arbitrum appears to have an edge in maintaining and growing its user base over time. However, the evolving nature of these platforms and the blockchain industry as a whole means that these trends could change, and continuous monitoring and analysis will be key to understanding their ongoing performance.
Revenue growth is a critical indicator of product-market fit. Detailed metrics can guide resource allocation and pricing decisions, with granular data revealing revenue concentration in specific products, cohorts, or user types. This insight is crucial for strategic decision-making and optimizing returns.


Examining the revenue parameters for Optimism and Arbitrum reveals some interesting dynamics. Gas fees, along with staking, provide the necessary funds for the company or DAO behind the blockchain to maintain and update it, making it a crucial revenue source. However, high gas fees can deter users, necessitating a careful balance. It appears that Arbitrum has managed to strike this balance more effectively than Optimism, generating higher revenue from gas fees.

Moreover, the high transaction volume on Arbitrum suggests that users are willing to pay these gas fees, indicating a perceived value in the services provided by the platform. This willingness to pay, despite the costs, could be a testament to Arbitrum's user experience, features, or performance.
In conclusion, while both Optimism and Arbitrum have their strengths, Arbitrum seems to have an edge in terms of revenue generation. Its ability to maintain high transaction volumes despite gas fees suggests a strong product-market fit and user satisfaction. However, as with all aspects of blockchain technology, these trends could change, and ongoing analysis will be key to understanding their financial sustainability.
Reach: Arbitrum appears to have a broader reach than Optimism, with a stronger social media presence and higher transaction volume. Its success in attracting new users, particularly within the DeFi sector, suggests a wider acceptance and utilization.
Retention: While both platforms have comparable levels of user engagement, Arbitrum seems to have a higher user loyalty over time. Despite a potential higher learning curve, users tend to stick with Arbitrum longer, indicating a more compelling user experience or features.
Revenue: Arbitrum also seems to lead in terms of revenue generation. Despite the gas fees, the high transaction volume indicates a strong product-market fit and user satisfaction, suggesting that users see value in the services provided by the platform.
Overall Performance: While both Optimism and Arbitrum have their strengths, Arbitrum appears to be leading in terms of reach, retention, and revenue. Its performance across these key indicators suggests a strong potential for future growth and sustainability.
Future Outlook: The landscape of blockchain technology is dynamic and rapidly evolving. These trends could change, and continuous monitoring and analysis will be key to understanding the ongoing performance and potential of both Optimism and Arbitrum.