It was the 1st of the month, a little after seven in the morning, and I was doing the second most dignified thing an income investor can do before coffee: watching a dividend land. Ding. Twenty-two dollars and five cents per hundred shares, right on schedule, the way it has landed every month for as long as I've been watching it.
There is no feeling in personal finance quite like dividend day. You did nothing. You lifted no finger. The money simply arrived, like a cat that has decided, today, to like you. For about five glorious minutes you feel like the kind of person who owns a boat.
Then I made the mistake of scrolling down from the deposit to the account value.
The deposit was green. The account value was not. And it had not been green, in any meaningful way, for about two years.
So yes. I have questions.
The fund in question is the PIMCO Dynamic Income Fund, ticker PDI. It is one of the most popular closed-end income funds in the country, run by one of the most respected bond shops on the planet. This is not a penny stock or a message-board special. Nobody here is accused of anything.
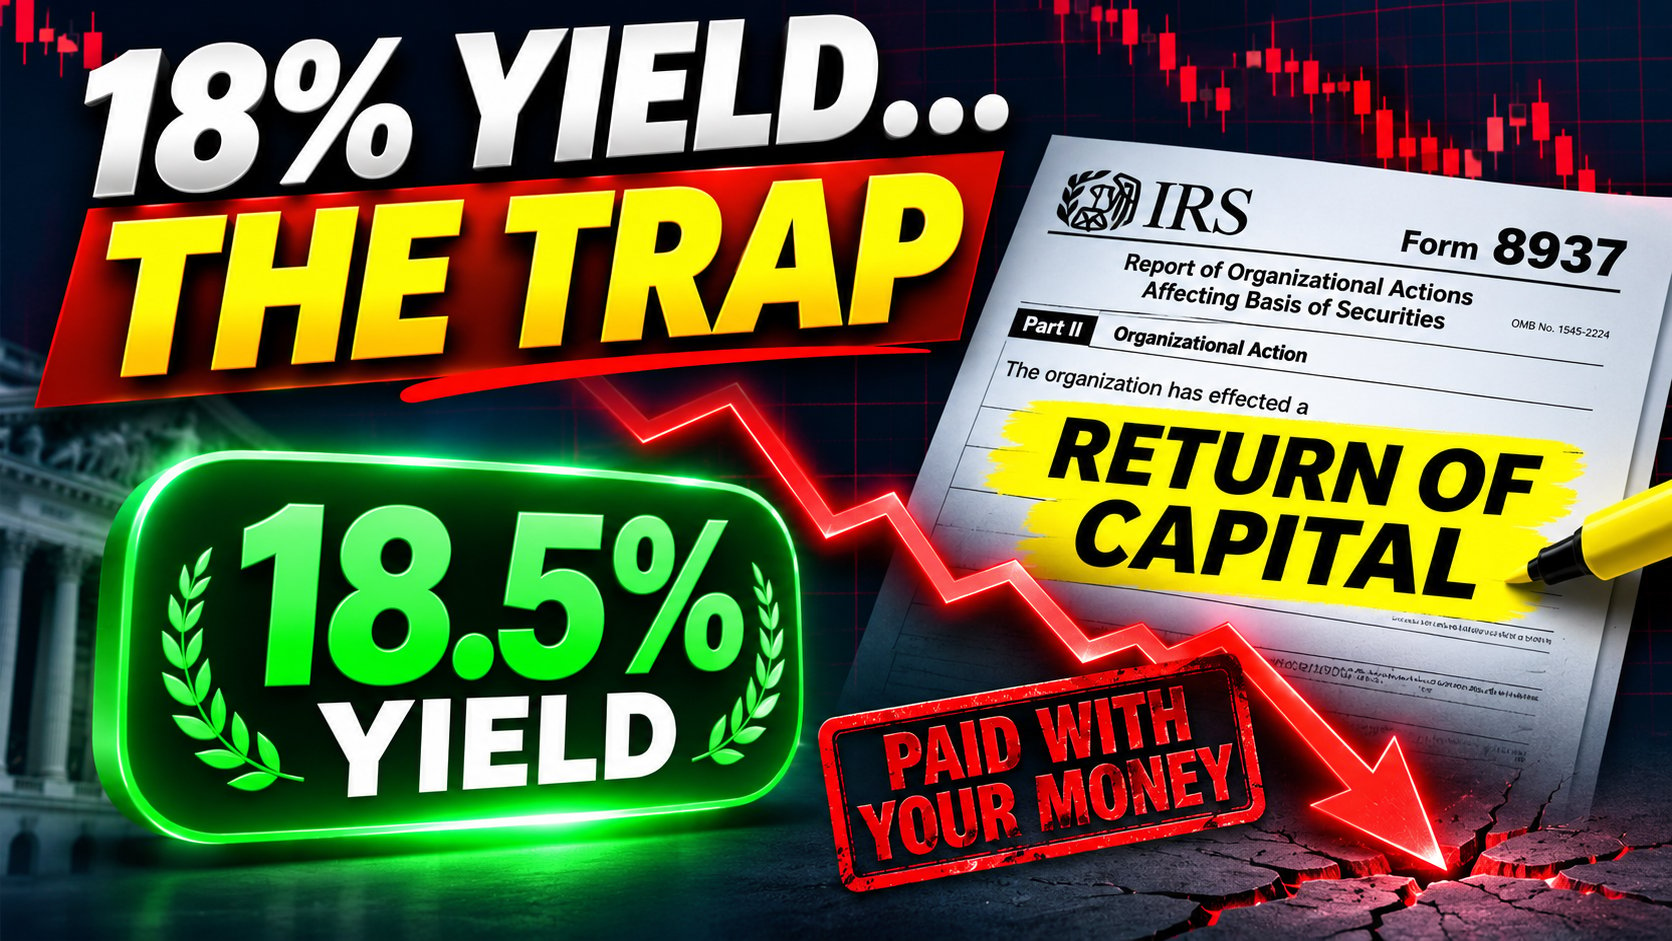
What the quote screen says. As of mid-November 2026, PDI shows a trailing yield of 18.58%, paying $0.2205 per share every month, about $2.65 a year. Its sister fund, the PIMCO Dynamic Income Opportunities Fund (PDO), shows 13.27%, paying $0.1279 a month. Both funds went ex-dividend on November 13, 2026. [UPDATE: Friday Nov 20 closing prices and trailing yields for PDI and PDO.]
What PIMCO's own report says. Every month PIMCO publishes a plain, unglamorous spreadsheet with an equally unglamorous name: its estimate of Undistributed Net Investment Income, or UNII. In everyday language, it shows how much interest the fund actually earned compared with how much it paid out. As of September 30, 2026:
PDI earned about $0.1552 a share per month in net investment income, against a $0.2205 distribution. Coverage: 70.39% on a three-month basis, 70.43% for the fiscal year to date. Its estimated UNII, the cushion, was negative 19 cents a share.
PDO earned about $0.1721 a share per month against a $0.1279 distribution. Coverage: 134.55%. Its cushion was positive 13 cents.
What the IRS filing says. When a fund pays out more than it earns, it has to say so on IRS Form 8937, the Report of Organizational Actions Affecting Basis of Securities, which very few people outside a tax department have ever read. PIMCO's 2025 Form 8937 for PDI states, in Box 14, that the fund paid distributions in excess of earnings and profits, which resulted in a return of capital. For the six monthly payments from January through June 2025, that return of capital totaled $0.5143 per share. PDO's figure for the same six months: $0.0552. That's roughly a tenth as much.
What the price chart says. PDI traded at about $19.10 in October 2024. In November 2026 it is about $14.20. That is a drop of roughly 25% while the payout never budged. PDO went from about $13.60 to about $11.60, down roughly 15%.
So: one fund, a famous yield, a payout it isn't fully earning, an IRS form that says so in writing, and a price that has been sliding the whole time.
Here's the part nobody puts on the screener.
A distribution can come from three places. One: real earnings, meaning interest, profits, actual cash the business or portfolio produced. Two: a one-time gain, which is the investment equivalent of selling the office furniture. It's real money, but you can only sell the furniture once. Three: your own capital, handed back across the table with a smile.
Option three is legal, disclosed, and sometimes perfectly sensible. It is also the reason for the most important sentence in PIMCO's own report, sitting in a footnote at the bottom: because the distribution may include a return of capital, it should not be confused with yield or income.
Read that again. The company paying the 18% is telling you, in writing, not to call it 18%.
I love this industry. Where else does the product come with a label that says, essentially, "this is not the product"? Imagine a restaurant menu: Lobster, $48. Note: may contain your own wallet.
To be fair, return of capital has a gentle cousin. Funds that own assets with hidden gains, like pipelines or real estate, sometimes classify payouts as return of capital for tax reasons while the underlying value holds up. That's the constructive kind. The destructive kind is when the fund simply doesn't earn enough and the payout eats into the principal that's supposed to keep producing the income.
How do you tell the two apart? You don't do it by feel. You check whether the earnings cover the payout, and you check whether the price is holding up. PDI fails the first test on PIMCO's own numbers, and the second on its own chart.
Because the screener did the math for you, and the math was wrong.
Here's the napkin version that every income investor has scribbled at least once:
$100,000 in... | Advertised yield | "Annual income" | Napkin conclusion |
|---|---|---|---|
A 3% dividend stock | 3% | $3,000 | Boring |
A 7% payer | 7% | $7,000 | Interesting |
PDI | 18.58% | $18,580 | Shopping for boats |
Now here is the same idea, per share, using what actually happened to PDI over roughly two years:
PDI, Oct 2024 to Nov 2026 | Per share |
|---|---|
Starting price (approx.) | $19.10 |
24 monthly checks at $0.2205 | +$5.29 |
Price change ($19.10 to about $14.20) | –$4.90 |
Net result, before taxes | about +$0.39, or roughly 2% in two years |
An 18.58% yield. Roughly 2% in two years. I did that math three times because I didn't believe it either.
Every check cleared. Nobody missed a payment. And still the shareholder who held from October 2024 to now came out almost exactly where they started, before taxes. Then they owe taxes on the income part. Then the return-of-capital part quietly lowered their cost basis, so they'll owe more when they eventually sell.
Now imagine you were living on those checks. Spending them, not reinvesting them. You'd have collected your $5.29 and watched each share lose $4.90. Your income would feel fine and your principal would be leaking, and you'd only notice when you scrolled down past the green deposit. That's a mirage. From a distance it looks like water.
And here's the real danger. When a fund pays out more than it earns for long enough, the usual ending isn't a dramatic collapse. It's a distribution cut. That's when income investors get Wall Street's favorite combination punch: the income drops, and the price drops with it, because the market reprices the fund around the new, smaller check. You lose the paycheck and a chunk of the savings in the same week.
I'm not predicting that for PDI. A negative UNII doesn't force an immediate cut. Funds can lean on realized gains, leverage and reserves for a long time. But "for a long time" is not the same as "forever," and it's a strange thing to retire on.
Let me argue with myself for a minute, because the other side has a real case.
The bull would say: PDI is a leveraged credit fund run by world-class managers. Its job is total return through a full credit cycle, not perfect monthly coverage. Rates moved against every bond fund on earth. Its sister fund PDO, which was earning its payout, also fell. So isn't this just a bad stretch for bonds dressed up as a morality tale?
And the bull is not wrong. PDO's 135% coverage didn't save its share price; it still fell about 15% over the same stretch. Even PDO's coverage wasn't always that strong: PIMCO's own monthly reports show it below 100% in the first half of 2026 before recovering. Macro weather and leverage costs hit everyone.
But that's exactly the point. Both funds got the same bad weather. Only one of them was also eating its own furniture to keep the checks clearing. PDO took a 15% hit with a cushion. PDI took a 25% hit while paying out 30% more than it earned, month after month. It was under 100% coverage in every month of 2026 through September, with readings between 48% and 77%.
PDI had the higher yield. PDO was the stronger fund. Those are not the same thing, and the screener only shows you one of them.
Here is the three-step routine we use before any high yield earns a spot on the list. None of it requires a finance degree, and all of it can be done before your coffee gets cold.
Step one: check the earnings. For a credit fund, compare net investment income with the distribution. Most fund families publish it monthly, often in a UNII or "distribution sources" report. For an ordinary company, compare earnings or free cash flow with the dividend: the payout ratio. Our rule: if a payer pays out more than it earns for more than two quarters in a row, it comes off the primary list. No exceptions for famous names.
Step two: read Form 8937, or the fund's Section 19 notice. Search the fund's website for "8937." If Box 14 says distributions were paid in excess of earnings and resulted in return of capital, find out how much. Five and a half cents over six months is a rounding error. Fifty-one cents is a business model.
Step three: look at the price trend. A healthy dividend payer tends to trade above its 200-day moving average over time. If the yield is climbing only because the price is falling, the yield isn't getting better. You're watching the denominator shrink. That isn't an opportunity. It's a falling knife wearing a name tag that says income.
That routine is exactly what the free DIVIDOND dividend radar does for you each week. On the November 11, 2026 scan, it screened 50 upcoming payers and flagged 8 yield traps. The pattern is hard to miss. Filter for yields of 5% or more and the payout grades turn red: Artisan Partners (APAM) at a 9.15% yield with a 103% payout ratio, Enbridge (ENB) at 5.78% paying out 133% of earnings, Amcor (AMCR) at 5.95% paying out 111%, and Walker & Dunlop (WD) at 6.89% with no earnings to compare against and a price nearly 16% below its 200-day average. Flip the filter to "payout under 75%" and the list gets calmer: smaller yields, real coverage, and mostly prices trending up. The boring list is the one that pays you next year.
And if your actual question is the one everyone Googles, how much do I need to invest to make $500 a month?, the income calculator answers it with honest yields instead of screener yields. At the blended 4.80% from our latest desk picks, $7,500 produces about $360 a year, or $30 a month. Getting to $500 a month takes about $125,000. That's less exciting than 18%. It also doesn't quietly hand you back your own money.
There's a reason the funds on the top of the yield column get all the attention: an 18% number is a story, and 4% is a spreadsheet. But the spreadsheet is the one that compounds.
The investors who get to financial independence on dividends don't usually do it by finding the biggest number. They do it by owning businesses and funds that earn what they pay, raise it over time, and still have their principal intact after a bad year for markets. Utilities, consumer staples, pipelines with real coverage, and well-run funds with a positive cushion. Unfashionable, predictable, and still standing when the party ends.
A dividend is a promise. Coverage is proof.
Don't ask what a fund pays. Ask what it earns.
Because a check doesn't do you much good if they're burning down your house to keep you warm.
Because apparently, this is normal now. It shouldn't be.
Coming Thursday: the Thanksgiving-week dividend desk. December's ex-dates, the three DIVIDOND desks, and the yield traps we wouldn't touch with your money.
Black Friday: Subscribe to DIVIDOND, $19.99 a month
Subscribe to DIVIDOND, $19.99 a month · The free dividend radar · Morningstar Investor, our research pick
Disclosure: the author does not own shares of PDI or PDO. Distribution amounts and yields are November 2026 quotes. Coverage ratios and UNII are PIMCO's own estimates as of September 30, 2026, and they change monthly. Return-of-capital figures are from PIMCO's 2025 IRS Forms 8937 (January–June 2025 distributions). Historical prices are approximate, read from exchange price charts, and the two-year total ignores reinvestment and taxes. Nothing here is investment advice.
Source: APAM, ENB, AMCR and WD payout data: DIVIDOND Nov 11 scan. Calculator figures: DIVIDOND Nov 11 scan desk mix. More at www.dividond.com.