

Cryptocurrency-collateralized stablecoins are a category of stablecoins that accept both volatile cryptocurrencies and other stablecoins as collateral. That is, they can accept cryptocurrencies such as Bitcoin, Ether, or Solana as collateral, or they can accept stablecoins such as USDT or USDC. The critical point here is that they can only obtain collateral in cryptocurrencies. Assets such as U.S. Treasury bills or bonds, cash, or repurchase agreements are not accepted as collateral for projects under this category.
Falcon USD (USDf), developed by Falcon Finance, is a synthetic stablecoin that is over-collateralized with various crypto assets. This means that instead of holding fiat money directly in bank reserves, users can issue USDf by pledging stablecoins such as USDT and USDC and volatile cryptocurrencies such as BTC and ETH as collateral.
The value of each USDf token is backed 1:1 or more by the value of a basket of different collateral; the protocol applies a dynamic overcollateralization ratio (OCR) to stabilize market volatility. Thus, even in the face of market volatility, the goal is to have more than ten assets under each USDf.
We go to Falcon Finance's transparency webpage, where we want to examine the breakdown of collateral assets. However, both on this page and in the collateral reports published by HT Digital, their independent auditors, we cannot see exactly what the collateral assets are. Instead of explaining what the collateral assets are, they have shared with us which custodian the collateral assets are stored with. Therefore, it is unclear what exactly is used as collateral. According to the data we were able to obtain, the collateral breakdown is as follows:
Collateral Asset or Custody Service Provider | Percentage |
Fireblocks | 29.721% |
Stablecoins | 15.277% |
Other Assets | 14.44% |
Binance | 20.656% |
Stablecoins | 3.153% |
Other Assets | 17.501% |
Ceffu | 16.588% |
Stablecoins | 8.965% |
Other Assets | 7.623% |
Bitcoin | 28.676% |
Near | 1.122% |
Other | 3.235% |
Total | 100% ($531.42M) |
USDf Collateral Asset Breakdown Table (June 23, 2025) Source: Falcon Finance
As can be seen from the table, even the independent audit report does not indicate which assets are held by the custodians. It is worth noting that the independent audit report is quite sloppy.
On the other hand, the interface on their website shows the distribution of collateral assets. According to this website, the collateral asset breakdown on July 25, 2025, is as follows:
Collateral Asset | Percentage |
Bitcoin | 56.54% |
Stablecoins | 23.28% |
Cryptocurrencies in the top 100 | 9.22% |
Solana | 5.20% |
Ethereum | 1.82% |
Other cryptocurrencies | 3.90% |
Tokenized US Treasuries | 0.0141% |
Total | 100% ($708,630,000) |
USDf Collateral Asset Breakdown Table (July 25, 2025) Source: Falcon Finance
The founder of Falcon Finance is Andrei Grachev, who is also the founder of DWF Labs, a controversial investor and market maker. Additionally, individuals who hold various roles at DWF Labs also perform similar duties at Falcon Finance. Although Falcon Finance's website does not have a dedicated page about the team, there is a verification interface where you can confirm the email addresses or X addresses of the team members. This is an effort to prevent scammers from impersonating members of the Falcon Finance team.
DWF Labs has pursued an aggressive growth strategy, investing in over 740 projects in 16 months. However, its provision of market-making services has not been well received by other market-making firms such as GSR and Wintermute. In response to rival market makers who have pointed out DWF Labs' lack of experience in this area, DWF Labs has countered by stating, “Our competitors are simply trying to spread fear.”
According to Binance's internal sources and claims by the Wall Street Journal, DWF Labs conducted “wash trades” worth $300 million in 2023 by buying and selling within its system. In response to these allegations of fake volume, Binance's oversight team sought to ban DWF Labs from its market makers. However, senior management did not enforce the ban due to insufficient evidence. Furthermore, according to another allegation, those within the oversight team who sought to ban DWF Labs were terminated from their positions.
In 2024, in a case allegedly occurring in Hong Kong, one of DWF Labs' partners was accused of spiking someone's drink with drugs. DWF Labs terminated the contract with the partner in question. Additionally, US senators have alleged that DWF Labs has ties to Russian mafia groups.
As examples of the above incidents, DWF Labs has faced numerous allegations of manipulation from the community and is therefore in a highly controversial position. Since Falcon Finance is a product of DWF Labs, there is no issue with evaluating them together.
USDf is only available on the Ethereum blockchain. Naturally, comparisons between blockchains are not possible. Here's a time-dependent supply chart of USDf created in February 2025:

As can be seen, USDf, which showed a steady upward trend especially until the end of May 2025, has entered a small-scale downward trend in the last month.
The chart of USDf's transaction volume over time is shown below:

As we have seen, when interpreting the supply data, we observe that the trading volume increases considerably in the weeks when the USDf supply decreases. Although there were no specific incidents in those weeks, the volumes suggest that some USDf was destroyed and USD was received in return.


As can be seen, the majority of USDf supply is held in the sUSDf contract to earn a return. This shows that users are using USDf to generate yield. This contract also accounts for most of the trading volumes. Some asset management applications also utilize the sUSDf return. Similarly, those looking to maximize returns can also benefit from incentives by providing liquidity to sUSDf-USDf pairs. We can observe that similar decentralized finance integrations also realize transaction volumes.
You can view the entire market data in the table below:
Stablecoin | Supply | Percentage |
Top 10 Biggest Projects | 244,255,760,104 | 97.27% |
USDf | 597,149,284 | 0.24% |
USD0 | 585,392,593 | 0.23% |
USDD | 529,443,135 | 0.21% |
RLUSD | 517,586,984 | 0.21% |
TUSD | 494,616,284 | 0.20% |
BUSD | 359,361,996 | 0.14% |
USDG | 356,892,437 | 0.14% |
FRAX | 322,434,572 | 0.13% |
GHO | 312,601,131 | 0.12% |
USR | 255,942,303 | 0.10% |
crvUSD | 129,548,378 | 0.05% |
Other | 2,382,259,359 | 0.95% |
Total | 251,098,989,565 | 100% |
Supply Breakdown and Percentages of Stablecoins by Project Source: Artemis and Coingecko
USDf is the 11th project in our table of big projects. Although there is still a lot of time for it to play in the big league, it is not difficult for it to enter the top 10 when it increases its supply. This interest can be increased by supporting more blockchains.
In order to benefit from the returns offered by Falcon Finance, it is necessary to buy the sUSDf token by pledging USDf.

As can be seen from the chart above, an annual return of around 10% is usually offered. It is also important to note that there is a 7-day waiting period to convert sUSDf back to USDf.
Falcon Finance also offers a flexible pledging alternative for sUSDf, which increases the amount of return to be obtained by locking sUSDf for a certain time.
sUSDf Lock-Up Duration | Rate of Return |
Unlocked | 1.00 multiplier (9.32%) |
Locked for 3 months | 1.05 multiplier (9.79%) |
Locked for 6 months | 1.25 multiplier (11.65%) |
Locked for 12 months | 1.50 multiplier (13.98%) |
sUSDf Locking Period and Rates of Return Table Source: Falcon Finance
It is worth mentioning again that if sUSDf is locked, neither the principal nor the rate of return can be obtained before the lock period expires.
Falcon Finance announced in early May that they would take part in the Ozean blockchain developed by the decentralized lending platform Clearpool. Ozean will use Optimism's infrastructure and focus on real-world assets (RWA).
Falcon Finance collaborated with Pendle Finance, a decentralized finance interest yield diversification application. Pendle-specific PT-sUSDf and YT-sUSDf versions of Falcon's yield token, sUSDf, were created. These versions were also listed on Morpho, a lending and borrowing application.
Falcon Finance also announced a partnership with Kaia Chain, the blockchain of LINE, the popular messaging app in the Asian region. Kaia Chain aims to reach the 250 million users of the LINE application. Falcon Finance aims to provide returns to these users with its USDf and sUSDf products.
USDD, introduced by a decentralized community on the Tron blockchain, is among the cryptocurrency-collateralized stablecoins. Other cryptocurrencies are used as collateral. These cryptocurrencies are primarily diversified as TRX, sTRX and USDT. This decentralized community, also known as the Tron DAO, is governed by governance tokens called JST.
The over-collateralization method that we are used to seeing in other cryptocurrency-backed stablecoins is used in collateralization. This is true for TRX and sTRX, but not for USDT. It is already an accepted fact that over-collateralization is inefficient in stablecoin-collateralized stablecoin projects. The current collateralization breakdown on Decentralized USD's website is as follows:
Collateral Asset | Percentage |
TRX (307% Collateralized) | 10.73% |
USDT (121% Collateralized) | 0.147% |
sTRX (254% Collateralized) | 1.454% |
PSM-USDT (100% Collateralized) | 30.87% |
SA-USDT (100% Collateralized) | 56.80% |
Total | 100% ($458,120,000) |
USDD Collateral Assets Breakdown Table Source: USDD
Although the project is marketing itself as being on Tron and collateralized by TRX, 87.5% of the collateral consists of Tether.
The stablecoin announced by Justin Sun, founder of the Tron blockchain, in May 2022 was created in May 2022. It is not only end users who invest in the reserves. Key figures such as Justin Sun, Poloniex, and Amber Group, as well as institutional investors, have contributed to the reserves. Additionally, the JST token used for governance is the governance token of the decentralized finance protocol Just Network on the Tron blockchain. Just Network also has a lending and borrowing application called JustLend, a liquid staking token named sTRX, and another stablecoin called JustStable.
Decentralized finance applications on the Tron blockchain generally work in conjunction with one another. Although USDD claims to be managed in a decentralized manner by a DAO, there is no forum where proposals can be reviewed or discussions followed. We learn from USDD's documentation that a forum may become available in the future.
USDD is natively only supported on the Tron blockchain.

Since USDD switched to the new smart contract in February 2025, only Coingecko provides integrated data across data sources. USDD supply, which amounted to USD 800 million before the transition to the new smart contract, gradually increased after the contract change. With a supply of just over 400 million in June 2025, USDD seems to have lost its growth curve over the last month.

USDD, which was on the rise in trading volumes until the end of May 2025, has been declining in terms of volume for the last month.


The vast majority of USDD supply and trading volume is conducted on centralized exchanges. The return partnerships provided by USDD are mostly realized with centralized exchanges. This is because the vast majority of Tron blockchain users are users of centralized exchanges.
You can view the entire market data in the table below:
Stablecoin | Supply | Percentage |
Top 10 Biggest Projects | 244,255,760,104 | 97.27% |
USDf | 597,149,284 | 0.24% |
USD0 | 585,392,593 | 0.23% |
USDD | 529,443,135 | 0.21% |
RLUSD | 517,586,984 | 0.21% |
TUSD | 494,616,284 | 0.20% |
BUSD | 359,361,996 | 0.14% |
USDG | 356,892,437 | 0.14% |
FRAX | 322,434,572 | 0.13% |
GHO | 312,601,131 | 0.12% |
USR | 255,942,303 | 0.10% |
crvUSD | 129,548,378 | 0.05% |
Other | 2,382,259,359 | 0.95% |
Total | 251,098,989,565 | 100% |
Supply Breakdown and Percentages of Stablecoins by Project Source: Artemis and Coingecko
USDD, which may have been in the top 10 projects before the smart contract change, is currently 13th on the stablecoin leaderboard.
USDD does not offer a direct return. For this, you need to look at partnerships that offer return opportunities through USDD's app. On centralized exchanges such as Kucoin, Gate, HTX, or MEXC, if you hold USDD in your account, you can earn a variable annual return of 6-8%. At the same time, if you invest USDD as collateral on JustLend, you can earn an annual return of close to 6%. JustLend stands out as the only decentralized finance protocol among partnerships. You can follow the current rates of return on the USDD Earn website. We would like to remind you that when obtaining these returns from a decentralized finance protocol, there is an extra smart contract risk, and when obtaining them from centralized exchanges, the real owner of the assets is the central exchange.
In April 2024, USDD price instability was caused by the withdrawal of USD 750 million worth of Bitcoin from USDD reserves. Justin Sun stated that this was done to optimize reserves and that there were still more over-collateralized reserves.
Then, in February 2025, USDD announced USDD 2.0, an update to the USDD smart contract. As a launch campaign, it partnered with the Exmo exchange, promising a 20% annualized rate of return. This campaign attracted a lot of attention, and it was stated that the number of users who want to benefit from the amount of return to be provided at the moment has reached the maximum value, and that 20% return will not be provided to new users within the scope of the campaign.
Curve Finance's cryptocurrency-collateralized stablecoin crvUSD, one of the leading protocols in decentralized finance, works similarly to MakerDAO's DAI stablecoin with borrowing positions against collateral (CDP). Unlike DAI, it does not liquidate instantly when the value of collateral assets falls below a minimum threshold. Liquidation happens gradually thanks to an algorithm called LLAMMA (Lending-Liquidation Autonomous Market Maker Algorithm). With this piecemeal structure, "soft liquidation" is realized.
To create crvUSD, crypto assets accepted as collateral through LlamaLend, Curve Finance's lending and borrowing protocol, are pledged as collateral, and crvUSD is created. crvUSD's collateral assets as of July 2, 2025, are as follows:
Collateral Asset | Percentage |
WBTC | 51.39% |
ETH | 21.60% |
tBTC | 10.42% |
wstETH | 7.51% |
cbBTC | 3.58% |
sfrxETH | 2.45% |
weETH | 1.80% |
LBTC | 1.25% |
Total | 100% ($214,970,000) |
crvUSD Collateral Asset Breakdown Table (July 2, 2025) Source: Curve Finance
As can be seen, the only collateral accepted for creating crvUSD is Bitcoin and Ethereum themselves or their derivative assets. The primary reason for accepting derivative assets as collateral is that users prefer to use existing derivative assets that are already generating returns rather than creating crvUSD using regular BTC or ETH. Approval from the governance body is required to accept new collateral assets.
As of July 2, 2025, the total crvUSD supply is approximately 129 million. This indicates a collateralization ratio of 166%. While higher collateralization enhances security, it also implies inefficiency.
crvUSD is a stablecoin created by Curve Finance, a decentralized finance protocol founded by Michael Egorov in January 2020. Curve Finance has enabled trading with low price deviations among stablecoins in the decentralized finance space. Interestingly, when Curve Finance's first whitepaper was released, it was initially named StableSwap, but later adopted the name Curve Finance when the protocol was ready for use.
Additionally, Curve Finance created the “vote-escrowed token” model, known as the CRV token. This established deep connections between liquidity and governance, serving as an example for other decentralized finance projects on how liquidity can be effectively utilized. The vote-escrowed token mechanism was so effective that dozens of protocols emerged to determine who would have a say in the pools on Curve Finance. The most popular of these is Convex Finance. These incentive distribution wars are known as the “Curve Wars” in decentralized finance history.
Curve Finance announced at a conference in July 2022 that it would launch a stablecoin. The whitepaper for crvUSD was published in November 2022, and after a six-month testing period, crvUSD was made available to users in May 2023. The team made numerous changes to the contracts during this six-month testing period. The primary reason for this was the team's desire for the final contract to be immutable and permanent. Additionally, crvUSD does not include a blacklist or freeze function.
Although Curve Finance is a proven and popular project, its stablecoin crvUSD has never been that popular. Even at its peak, the total supply could only reach close to 180 million.

The amount of crvUSD supply is quite small, considering that the total assets locked on Curve Finance (TVL) is $1.8 billion. As of July 3, 2025, the total crvUSD supply is 118 million.
crvUSD can only be created on the Ethereum blockchain. There is no support for the protocol on other blockchains. It is also possible to transfer crvUSD to other blockchains through bridge applications.
There are many inconsistencies in the data of Artemis.xyz crvUSD, which is used as a volume data source. Therefore, trading volume data will not be analyzed since it cannot be interpreted correctly.


As can be seen, the first place in both supply and trading volume (the numerical values for trading volume data are not accurate; the scale below is not realistic) belongs to decentralized finance. This is mainly because crvUSD is not backed by any centralized exchange (CEX). In particular, the GENIUS stablecoin law passed in the US at the end of June requires crvUSD to have a freeze function. The centralized exchanges are not warm to this decentralized and unregulated stablecoin. Therefore, all transactions and supply take place on decentralized finance.
The yield-generating derivative stablecoin token of crvUSD is scrvUSD (Savings Curve USD). The average yield rate of scrvUSD over the past six months is 4.57%. This yield is derived from the returns generated by the collateral provided to create crvUSD and transaction fees. Transaction fees are collected from users who borrow crvUSD from Curve Finance.
These revenues are distributed to crvUSD holders and scrvUSD holders. Currently, 45 million crvUSD have been converted to scrvUSD. The savings crvUSD conversion rate was initially low when the scrvUSD product was first launched, resulting in yield rates exceeding 20%. This attracted users, leading many to purchase crvUSD and convert it to scrvUSD. As a result, the yield rate naturally decreased and stabilized between 4% and 5%.
scrvUSD operates under the previously mentioned “yield-bearing” model. This means that the generated returns are not distributed but used to increase the value of scrvUSD. As of today, 100 USD worth of scrvUSD, if it maintains a 4.5% return rate for a year, will be worth 104.5 USD at the end of the year.
You can view the entire market data in the table below:
Stablecoin | Supply | Percentage |
Top 10 Biggest Projects | 244,255,760,104 | 97.27% |
USDf | 597,149,284 | 0.24% |
USD0 | 585,392,593 | 0.23% |
USDD | 529,443,135 | 0.21% |
RLUSD | 517,586,984 | 0.21% |
TUSD | 494,616,284 | 0.20% |
BUSD | 359,361,996 | 0.14% |
USDG | 356,892,437 | 0.14% |
FRAX | 322,434,572 | 0.13% |
GHO | 312,601,131 | 0.12% |
USR | 255,942,303 | 0.10% |
crvUSD | 129,548,378 | 0.05% |
Other | 2,382,259,359 | 0.95% |
Total | 251,098,989,565 | 100% |
Supply Breakdown and Percentages of Stablecoins by Project Source: Artemis and Coingecko
Unfortunately, we do not see crvUSD in the table above. With a market capitalization of 129 million, crvUSD still has a long way to go before it makes it into the top 20 largest projects.
In March 2025, following decisions made in Curve governance, cbBTC, LBTC, and weETH collateral were added to the list of accepted assets for creating crvUSD. Additionally, new pools with leverage capabilities were created in LlamaLend, the product where crvUSD is created. Curve Finance's borrowing and lending application, LlamaLend, has added new stablecoins to its pools through collaborations with various other stablecoin projects. For example, USDe, the stablecoin of Ethena, can be provided as collateral to borrow crvUSD. The borrowed crvUSD can then be used to purchase USDe again, thereby replenishing the collateral. This cycle can be automated through the app's features, creating a leverage effect of up to 53 times. With this update, the stablecoins and derivative stablecoin tokens that can be used to create leveraged borrowing and lending positions are as follows: sfrxUSD, sDOLA, sUSDe, USDe, sUSDS, WFRAX, scUSD.
In June 2025, Curve Finance founder Michael Egorov announced the YieldBasis project. The project, which is based on an automatic market maker (AMM) model without impermanent loss, had its whitepaper published. The project's X profile states that it will initially focus on Bitcoin.
Aave's stablecoin GHO, the tried-and-tested lending and borrowing protocol of decentralized finance, works based on borrowing positions against collateral (CDP).
Aave is a platform where you can earn interest income from the interest paid by borrowers who borrow funds by depositing collateral. This collateral deposit model is also used for GHO. Users deposit collateral in the same way they would to lend money. They can then borrow GHO by creating it at a rate lower than the collateral value. The borrowing rate for the collateral deposited is determined by the Loan-to-Value (LTV) ratios in Aave's internal markets. For example, the LTV ratio is 80.5% for ETH and 73% for WBTC.
The creation and destruction of GHO are carried out by individuals and institutions called “facilitators.” Users use the Aave facilitator when borrowing GHO. In other words, Aave also acts as an institution with the authority to create and destroy GHO.
Normally, borrowing positions against collateral are only created to generate that stablecoin. However, GHO's model does not work this way. For example, you can deposit your Ether into Aave to earn yield. By borrowing GHO, you create GHO. The key difference here is that since you did not deposit your Ether solely to create GHO, your assets cannot be directly calculated as collateral. Due to this architectural change, collateral asset calculations are determined by aggregating the collateral of individuals who have already deposited collateral in Aave and borrowed GHO (i.e., created GHO).
As of July 8, 2025, the approximate collateral asset breakdown is as follows:
Collateral Asset | Percentage |
WBTC | 21.2% |
AAVE | 17.9% |
WETH | 14.9% |
cbBTC | 10.8% |
tBTC | 8% |
wstETH | 7% |
USDS | 5.9% |
USDC | 4.4% |
LBTC | 2.9% |
weETH | 2.3% |
rETH | 1.3% |
sUSDe | 1.1% |
LINK | 1.1% |
eBTC | 0.4% |
USDT | 0.2% |
osETH | 0.1% |
cbETH | 0.1% |
Others | 0.4% |
Total | 100% ($591,531,000) |
GHO Collateral Assets Breakdown Table (July 8, 2025) Source: Aave Analytics
As can be seen, the collateral is quite diverse and not concentrated in a few assets. This ensures that GHO is not affected much by instant price movements.
Although Aave was founded by Stani Kulechov, it is a fairly old protocol, so its governance is almost completely decentralized. The idea for GHO also came about as a result of a proposal submitted by the community. After receiving nearly 100% support in a community vote, the idea was first tested on Ethereum's test networks and then became available on the Ethereum mainnet in July 2023.
Currently, GHO's governance is also handled by the DAO within the Aave protocol. Many metrics on Aave are decided by AAVE token stakers. When the founding team wants to make a fundamental change to the community-governed Aave protocol, they must obtain approval from the community.
GHO was initially only accessible on the Ethereum network. Later, with the bridge application in the Aave application, it became available on Base and Arbitrum networks. As of July 11, 2025, the breakdown of the supply on blockchains is as follows:
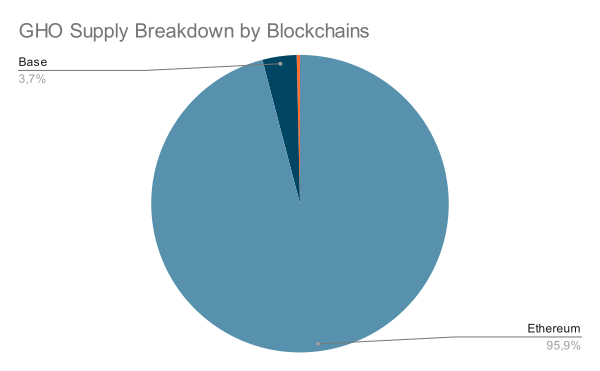
Blockchain | Supply | Percentage |
Ethereum | 312,000,431 | 95.92% |
Base | 12,105,484 | 3.72% |
Arbitrum | 1,156,610 | 0.36% |
Total | 325,262,525 | 100% |
GHO Supply Breakdown by Blockchains Table Source: Blockscan
As can be seen, the majority of the supply is on the Ethereum network. The Base network also appears to have a higher supply than Arbitrum, unlike other stablecoin projects. This also shows that the Aave protocol is actively used in the Base network.
Artemis, used as a volume data source, does not track trading volumes on the Base network for the GHO stablecoin. Therefore, the volume breakdown for June 2025, including only Ethereum and Arbitrum, is as follows:
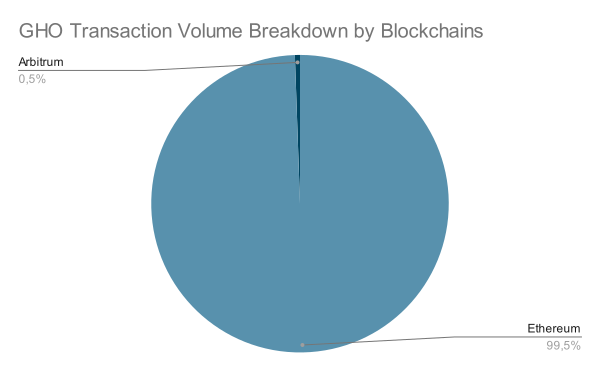
Blockchain | Transaction Volume | Percentage |
Ethereum | 1,900,000,000 | 99.45% |
Arbitrum | 10,500,000 | 0.55% |
Total | 1,910,500,000 | 100% |
GHO Transaction Volume Breakdown by Blockchains (June 2025) Source: Artemis
Arbitrum, which currently has a weaker supply than Base, does not have strong data in terms of transaction volume. Therefore, Ethereum has an almost 100% advantage.


Again, we see that decentralized finance takes the first place in both supply data and transaction volume. The transactions that take second place in terms of infrastructure in transaction volume represent treasuries using multi-sig wallets. GHO is among the most actively used stablecoins in decentralized finance.
You can view the entire market data in the table below:
Stablecoin | Supply | Percentage |
Top 10 Biggest Projects | 244,255,760,104 | 97.27% |
USDf | 597,149,284 | 0.24% |
USD0 | 585,392,593 | 0.23% |
USDD | 529,443,135 | 0.21% |
RLUSD | 517,586,984 | 0.21% |
TUSD | 494,616,284 | 0.20% |
BUSD | 359,361,996 | 0.14% |
USDG | 356,892,437 | 0.14% |
FRAX | 322,434,572 | 0.13% |
GHO | 312,601,131 | 0.12% |
USR | 255,942,303 | 0.10% |
crvUSD | 129,548,378 | 0.05% |
Other | 2,382,259,359 | 0.95% |
Total | 251,098,989,565 | 100% |
Supply Breakdown and Percentages of Stablecoins by Project Source: Artemis and Coingecko
Although it is the stablecoin of Aave, one of the proven protocols, GHO is still at the bottom of the top 20. The main reason for this seems to be that it is not supported by centralized exchanges. The blacklist function, one of the requirements of the stablecoin law adopted in the US at the end of June, is not available in GHO. This is why centralized exchanges are cautious about GHO integration.
GHO implements the staking model, which we frequently see in other stablecoin projects, for the purpose of generating returns. Users stake their GHO to receive sGHO, a derivative stablecoin token. The staked GHO is used as collateral to be lent to individuals seeking to borrow GHO. As of July 11, 2025, the yield of sGHO is 7.77%.
As a result of the governance vote held in June 2025, it was decided to launch GHO as a market on the Avalanche blockchain. Following Ethereum, Base, and Arbitrum, users will now be able to access GHO on the Avalanche network. Initially, GHO will only be available for borrowing and cannot be used as collateral.
In May 2025, another corporate use case for GHO was observed. Instead of directly selling ETH, the Ethereum Foundation began borrowing GHO by collateralizing ETH, marking the start of institutional-level GHO usage. By borrowing 2 million GHO, the Ethereum Foundation has fully embraced decentralized finance.
As we mentioned earlier, Aave had already converted its security protocol to a model accessible to the community through the Umbrella update. This allows users to earn higher returns on their sGHO by taking on the risk of penalties. The normal return rate of 7.77% increases to 8.79% for GHO staked under the Umbrella program. While the absence of any penalties so far makes Umbrella appear risk-free, users in this program are taking on the risk of not being able to access their assets for a certain period of time.