

In this category, we will analyze Tether, Circle, and MakerDAO projects, which account for 94.4% of the market capitalization of stablecoins. USDT, USDC, and DAI are stablecoins that almost all of us have at least heard of or used before. We will cover the developments of these giants in this part of the report and focus on other projects in the rest of the report.
Note: The collateralization method of stablecoin projects under this category will be shared in the project information.
Tether is a US Dollar denominated stablecoin project founded in 2014 and originally created on the Omni Protocol on the Bitcoin blockchain. The issuer of Tether is Tether Holdings Ltd. This company is affiliated with iFinex Inc., which also owns the Bitfinex exchange. The company is based in the British Virgin Islands (BVI). In 2019, Tether overtook Bitcoin to become the most widely used cryptocurrency. According to Forbes in July 2024, Tether has more than 350 million users worldwide.
Tether is a stablecoin that is fiat-backed as a method of collateralization. Collateralization products include cash, cash equivalents, and short-term deposits. In addition, Tether's collateral includes precious metals, Bitcoin, collateralized loans, and corporate bonds. According to the last published transparency report (March 31, 2025), Tether's collateralization products are shared in percentage terms in the table below:
Collateral Asset | Percentage |
Cash, Cash Equivalents, and Short-Term Deposits | 81.49% |
Collateralized Loans | 5.91% |
Bitcoin | 5.13% |
Precious Metals | 4.47% |
Other Investments | 3% |
Corporate Bonds | 0.0096% |
Total | 100% ($149,274,515,988) |
Tether (USDT) Collateralization Breakdown (March 2025) Source: Tether
As can be seen, the majority of collateral consists of cash and cash equivalents. For better understanding, this asset class is detailed in the table below:
Cash, Cash Equivalents, and Short-Term Deposits | 81,49% |
US Treasury Bills | 66% |
Overnight Reverse Repos | 10,11% |
Money Market Funds | 4,21% |
Reverse Repos | 1,08% |
Cash and Bank Deposits | 0,043% |
Non-US Treasury Bills | 0,044% |
Tether (USDT) "Cash, Cash Equivalents, and Short-Term Deposits" Collateralization Breakdown (March 2025) Source: Tether
Initially, Tether's reserves were intended to be all-cash, but the company announced an update in March 2019 that collateral was backed by broader reserves, not just cash dollars. This update raised concerns that Tether was not maintaining 1:1 reserves for all stablecoins at the time.
The New York Attorney General's Office (NYAG) launched an investigation in 2019, which revealed that the Bitfinex exchange was attempting to recover USD 850 million in losses from Tether reserves. In February 2021, Tether and Bitfinex were fined a total of USD 18.5 million. In addition to this fine, it was also decided that Tether must regularly report the distribution of its reserves. After this fine, Tether started to submit quarterly transparency reports and, as of July 2022, started to submit regular asset confirmation reports through an independent audit firm, BDO Italia. Although a full financial audit report has not yet been submitted by an independent firm, Tether has indicated that it is working to have one of the "Big Four" firms undertake it.
The CEO of Tether Holdings Ltd is currently Paolo Ardoino. Paolo, who became CEO in December 2023, has already served as the company's chief technology officer (CTO) since December 2017. Paolo has also held the position of chief technology officer (CTO) at Bitfinex for 10 years concurrently. Similar to Paolo, Giancarlo Devasini, who also serves as Chairman of Tether, is also the chief financial officer (CFO) at Bitfinex. In addition, Claduai Lagorio has been the chief operating officer (COO) of both companies for 6.5 years. As can be seen, Bitfinex and Tether are highly intertwined, both in terms of people in management and management decisions.
Although Tether initially emerged using the Omni protocol on the Bitcoin blockchain, it has not lagged behind in supporting popular blockchains. Tether currently supports a total of 18 blockchains, including Tron, Ethereum, Solana, TON, Aptos, and Avalanche. In addition to supporting these blockchains, Tether was so popular that it was preferred as the main stablecoin even on blockchains that did not officially create USDT. That's why Tether announced USDT0 in early 2025. Using LayerZero's technology, this product paved the way for you to transfer your USDT to any blockchain you want. In other words, a more fundamental solution to the fraction problem, which was previously solved through various bridges or agreements with blockchains.
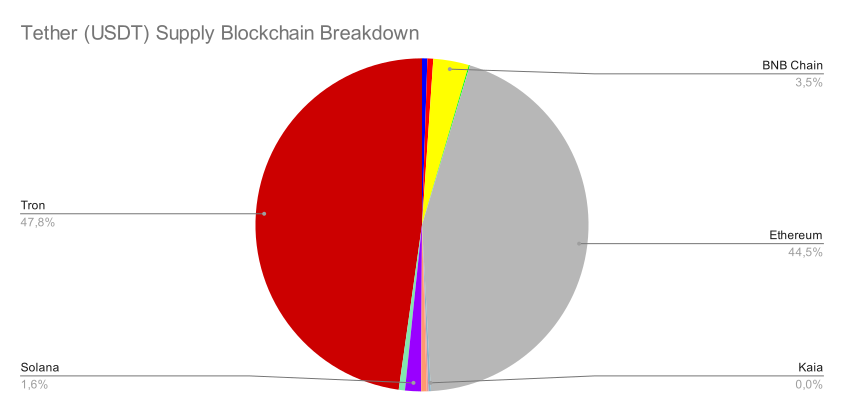
Blockchain | Supply | Percentage |
Arbitrum | 777,846,146.77 | 0.52% |
Avalanche | 851,499,112.49 | 0.57% |
BNB Chain | 5,186,009,687.16 | 3.45% |
Celo | 161,434,475.54 | 0.11% |
Ethereum | 66,870,722,617.38 | 44.50% |
Kaia | 3,862,303.42 | 0.00% |
Mantle | 360,357,672.97 | 0.24% |
Optimism | 240,416,284.25 | 0.16% |
Polygon PoS | 798,598,708.60 | 0.53% |
Solana | 2,338,869,133.23 | 1.56% |
Sonic | 3,988,581.58 | 0.00% |
TON | 899,048,433.27 | 0.60% |
Tron | 71,773,887,912.18 | 47.76% |
Tether (USDT) Supply Breakdown by Blockchain and Percentages (June 2025) Source: Artemis
As can be seen from the table and chart above, the majority of the supply is concentrated on the Tron and Ethereum blockchains. Although secondary layer solutions on Ethereum are also supported, the majority of the supply is on Ethereum. The majority of assets on the Tron network can be attributed to the fact that many centralized exchanges support the Tron network.
At the same time, Tron is very active in stablecoin collaborations. The founder of the network, Justin Sun, is actively participating in conferences on stablecoins and informing users about developments.
You can view the volume values in the graph and table below.
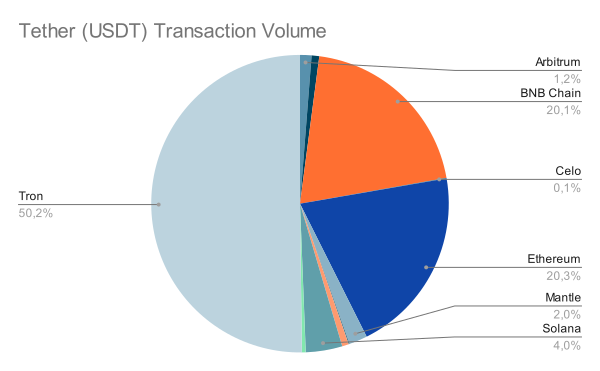
Blockchain | Volume | Percentage |
Arbitrum | 15,983,247,633.78 | 1.25% |
Avalanche | 10,636,832,515.22 | 0.83% |
BNB Chain | 258,517,770,894.96 | 20.15% |
Celo | 659,933,795.52 | 0.05% |
Ethereum | 260,856,542,357.95 | 20.33% |
Kaia | 73,577,488.94 | 0.01% |
Mantle | 25,259,341,227.72 | 1.97% |
Optimism | 1,544,210,419.23 | 0.12% |
Polygon PoS | 9,176,550,078.75 | 0.72% |
Solana | 59,819,022,491.44 | 3.96% |
Sonic | 209,994,253.27 | 0.02% |
TON | 5,204,323,820.16 | 0.41% |
Tron | 644,078,711,297.91 | 50.20% |
Tether (USDT) Transaction Volume Blockchain Breakdown and Percentage Table (June 2025) Source: Artemis
When we examine the transaction volume, we see the Tron network advancing in correlation with the supply. On the other hand, although the Ethereum network contains 44.5% of the supply, this rate decreased to 20.33% in volume. We can interpret from this that USDTs on the Ethereum network are generally evaluated in longer-term protocols or left idle instead of taking part in active transactions. BNB Chain, on the other hand, has a very high volume of 20.15%, despite holding 3.45% of the supply. This shows that USDTs on BNB Chain are being actively used.


When we examine the distribution of supply and volume by sector, we can see that centralized exchanges (CEXs) hold the overwhelming majority. This shows that USDT is generally used to trade on centralized exchanges or to transfer assets between CEXs. After centralized exchanges, decentralized finance (DeFi) transactions stand out in the volume data. Although decentralized finance ranks 4th in supply data, the fact that it ranks 2nd in volume data shows us that USDTs evaluated in decentralized finance protocols are actively used.
You can view the entire market data in the chart and table below:
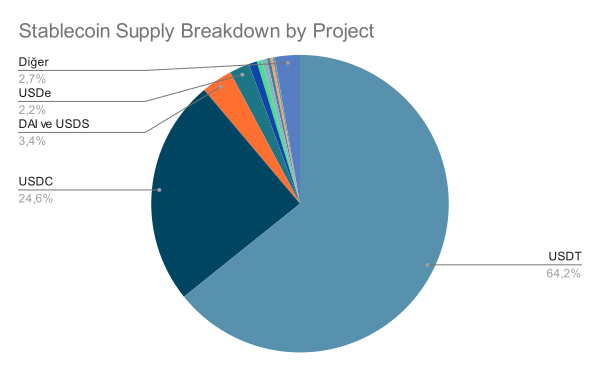
Stablecoin | Supply | Percentage |
USDT | 161,310,145,128.40 | 64.24% |
USDC | 61,805,458,863.36 | 24.61% |
DAI and USDS | 8,426,355,202.24 | 3.36% |
USDe | 5,502,376,876.23 | 2.19% |
USD1 | 2,211,713,093.08 | 0.88% |
USDtb | 1,452,411,245.98 | 0.58% |
FDUSD | 1,391,489,508.31 | 0.55% |
PYUSD | 869,097,812.41 | 0.35% |
USDX | 674,713,825.45 | 0.27% |
USDY | 601,998,548.59 | 0.24% |
Other | 6,843,229,460.95 | 2.73% |
Total | 251,098,989,565.00 | 100% |
Supply Breakdown and Percentages of Stablecoins by Project (July 2025) Source: Artemis
As you can see, Tether is still the clear leader in the stablecoin market. This is mainly because Tether was founded even before Ethereum. The project, which users have gotten used to and trusted from the very beginning, continues to lead the stablecoin market, although it has had some trust issues over time, as we mentioned.

Although the supply of USDT has increased over time, it is not possible to say that it has increased in percentage terms. In May 2020, the percentage of the stablecoin market Tether, which accounts for 82.5%, declined to 63.1% in May 2025, 5 years later. In fact, when we analyze only the last 1 year, this decline has come from 69.4% to 63.1%. Tether has lost 6.3% of its share of the pie in the last 1 year. This may be mainly due to the interest in new projects such as Ethena (USDe) or World Liberty Financial (USD1). In addition, we can say that Circle's (USDC) cooperation in the last year has been effective in Tether's loss of share.
Tether does not have a mechanism to share the proceeds from the assets it holds as collateral with users. In various decentralized finance protocols, the returns offered by the protocol may be preferable.
Tether decided to cut its support for the blockchains it initially supported, where demand was low. At the end of June 2024, support on the Algorand and EOS networks ended. Despite the end of support, it is still possible to see USDT being used on these networks. In addition, support for Polkadot's test network, Kusama, and Bitcoin Cash networks will end in September 2025.
In addition, Tether and Tron established an initiative called the T3 Financial Crime Unit (T3 FCU) at the end of 2023. With this initiative, they track crimes and money laundering transactions on the blockchain. The initiative, supported by TRM Labs, has so far frozen over 160 million USD in assets related to these crimes.
As mentioned in our previous PayFi report (Turkish), Tether aims to reduce inefficient waiting times for international payments by establishing a sub-unit. The unit, which previously funded an oil deal in the Middle East, has indicated that it is ready for bigger transfers.
We mentioned that Tether supports creation and destruction on 18 blockchains. It even decided to cut this support to some blockchains. Tether released USDT0 by adopting LayerZero's Omnichain Fungible Token (OFT) standard to support all of the blockchains, which increased significantly in 2024 and 2025.
According to this standard, USDT tokens are locked to a smart contract on the Ethereum blockchain. On the target blockchain, USDT0 tokens are created in the locked amount. In this way, fragmented liquidity and security issues are solved. An application called Legacy Mesh was announced for the transfer on blockchains where the original USDT is supported, other than Ethereum. Transfers can be made directly to Arbitrum from blockchains such as Tron or TON. It is possible to transfer from USDT0 created in Arbitrum to all blockchains where USDT0 is supported. As a result of this move, we could see Tether choose Ethereum and Arbitrum as its main liquidity center.
USDC is a stablecoin created in October 2018 by the CENTRE Consortium, a partnership between Coinbase and Circle. Circle claims to be "the world's most licensed stablecoin company" on its website. Since its emergence, Stablecoin has been aiming to offer a more transparent and reliable stablecoin as a competitor to Tether.
Circle natively supports a total of 20 blockchains, including Ethereum, Solana, Arbitrum, and Base.
USDC claims that it can always be converted into US dollars at a 1:1 ratio. It uses cash and short-term treasury bills as collateral. A significant portion of the collateral is held through the Circle Reserve Fund, which is managed by BlackRock, the world's largest fund issuer. This reserve fund also includes overnight repo rates in addition to short-term treasury bills.
Circle is audited every month by Deloitte, one of the Big Four, and publishes reports on its reserves. These reports can be accessed from the transparency section of Circle's website. You can view the collateral distribution in the April 2025 transparency report in the table below:
Collateral Asset | Percentage |
BlackRock Circle Reserve Fund | 88.186% |
Cash Held at Financial Institutions | 11.814% |
Total | 100% ($61,477,725,087) |
Circle (USDC) Collateral Breakdown (April 2025) Source: Circle
Collateral Asset | Percentage |
US Treasury Bills | 41.449% |
US Treasury Repos | 51.139% |
Cash | 1.633% |
Reserve Fund Cash Debt | -6.035% |
Total | 88.186% |
BlackRock Circle Reserve Fund Breakdown (April 2025) Source: Circle
Circle appears to be taking steps toward its founding goal of becoming a “more reliable and transparent stablecoin than Tether.” Both its decision to publish reports every month instead of every three months and its decision to be audited by one of the world's largest auditing firms instill greater confidence in users. Additionally, the fact that the majority of its reserves are managed by BlackRock, one of the world's largest financial institutions, is another factor that contributes to user confidence.
Although USDC was developed by the CENTRE Consortium, a partnership between Coinbase and Circle, the CENTRE Consortium was disbanded in 2023. After this development, Circle was positioned as the sole issuer of USDC. Coinbase, on the other hand, received a stake from Circle. Circle was founded in 2013 by Jeremy Allaire and Sean Neville, who is now the CEO of the company. While Jeremy continues in his role, the other co-founder, Sean, is only involved in a board member role.
Circle received compliance one day after the European Union's Markets in Crypto-Assets Regulation (MiCA) law came into force on June 30, 2024. Following this, by the end of the first quarter of 2025, giant centralized exchanges such as Binance and Coinbase, citizens living in the European Union, were banned from using stablecoins that are not MiCA compliant. Since Circle is one of the few stablecoin projects with this compatibility, it has come to the fore as one of the stablecoins that citizens living in the European Union can use.
Circle provides native support for a total of 20 blockchains that users are actively using. Created in 2018 on the Ethereum blockchain, USDC still holds the majority of its supply on the Ethereum blockchain.
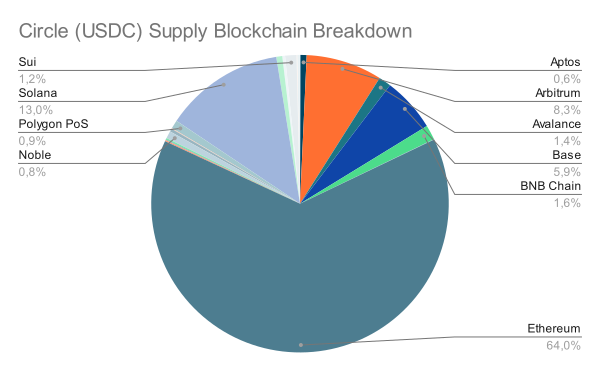
Blockchain | Supply | Percentage |
Algorand | 49,240,000 | 0.08% |
Aptos | 396,230,000 | 0.64% |
Arbitrum | 5,140,000,000 | 8.28% |
Avalanche | 839,530,000 | 1.35% |
Base | 3,670,000,000 | 5.91% |
BNB Chain | 998,400,000 | 1.61% |
Celo | 23,960,000 | 0.04% |
Ethereum | 39,750,000,000 | 64% |
Hedera | 80,990,000 | 0.13% |
Linea | 15,960,000 | 0.03% |
Mantle | 22,500,000 | 0.04% |
NEAR | 111,100,000 | 0.18% |
Noble | 496,940,000 | 0.80% |
Optimism | 205,960,000 | 0.33% |
Polkadot | 41,730,000 | 0.07% |
Polygon PoS | 576,670,000 | 0.93% |
Solana | 8,100,000,000 | 13.04% |
Sonic | 404,260,000 | 0.65% |
Stellar | 186,550,000 | 0.30% |
Sui | 767,830,000 | 1.24% |
Tron | 40,400,000 | 0.07% |
Unichain | 167,680,000 | 0.27% |
ZKsync | 21,510,000 | 0.03% |
Total | 62,107,440,000 | 100% |
Circle (USDC) Supply Blockchain Breakdown Table (May 2025) Source: Circle & Artemis
As we can see from the data above, the majority of the supply is on the Ethereum blockchain. There is also a considerable amount of supply in Layer 2 solutions such as Base and Arbitrum. If we calculate the sum of the offerings on Ethereum and secondary layer solutions, it exceeds 80%. This shows us that Circle is mostly intertwined with the Ethereum ecosystem. Also in Solana, the 13.27% supply shows that USDC is also frequently used on the Solana network. Even though Tether is well above Circle in total market capitalization, this is not the case for the Solana network. The USDC supply on Solana is almost 3.5 times the size of the USDT supply.
You can view the volume values of Circle's blockchains in the charts below:
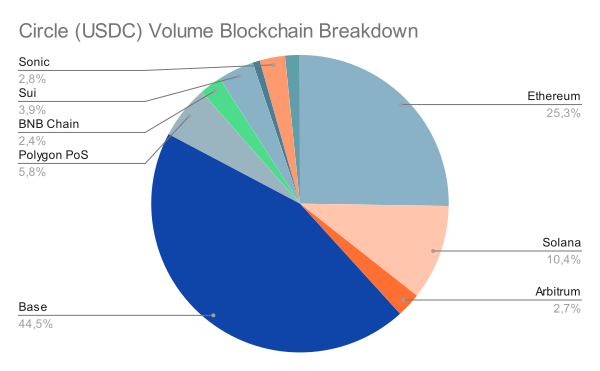
Blockchain | Volume | Percentage |
Ethereum | 567,800,000,000 | 25.26% |
Solana | 232,800,000,000 | 10.35% |
Arbitrum | 59,600,000,000 | 2.65% |
Base | 1,000,000,000,000 | 44.48% |
Polygon PoS | 129,600,000,000 | 5.76% |
BNB Chain | 54,500,000,000 | 2.42% |
Sui | 88,100,000,000 | 3.92% |
Avalanche | 17,600,000,000 | 0.78% |
Sonic | 61,900,000,000 | 2.75% |
Optimism | 35,700,000,000 | 1.59% |
Tron | 4,500,000 | 0.00% |
Mantle | 219,400,000 | 0.01% |
Celo | 401,200,000 | 0.02% |
Kaia | 4,700,000 | 0.00% |
Total | 2,248,229,800,000 | 100% |
Circle (USDC) Volume Breakdown by Blockchains Chart (May 2025) Source: Artemis
Base is the most striking blockchain in the data above. Base blockchain, which provides almost half of the volume alone, accounts for only 6% of USDC's supply. In contrast, nearly half of the volume created in all blockchains is provided by the Base blockchain. This proves that USDCs on the Base network are not idle and are actively being used in transactions. Similarly, USDCs on Polygon's Proof-of-Stake (PoS) blockchain are also being actively used.
Note: Although Circle (USDC) actively uses the Stellar blockchain, Artemis, the source of the trading volume data, does not support the Stellar blockchain, so the data cannot be shared here.


Centralized exchanges (CEX) hold the majority of supply, followed closely by decentralized finance (DeFi) protocols. However, most of the transaction volume is provided by decentralized finance protocols. At the same time, we can also see USDC being used in maximum extractable value (MEV) transactions on blockchains that can almost reach the volume of decentralized finance. Maximum extractable value (MEV) transactions are the name given to bots taking advantage of the arbitrage differences that bots see in transactions on blockchains. Since bots take advantage of the smallest arbitrage opportunities, no matter how big or small, it's no surprise to see high volumes in MEV transactions while decentralized finance trades see such high volumes.
You can view the entire market data in the chart and table below:
Stablecoin | Supply | Percentage |
USDT | 161,310,145,128.40 | 64.24% |
USDC | 61,805,458,863.36 | 24.61% |
DAI and USDS | 8,426,355,202.24 | 3.36% |
USDe | 5,502,376,876.23 | 2.19% |
USD1 | 2,211,713,093.08 | 0.88% |
USDtb | 1,452,411,245.98 | 0.58% |
FDUSD | 1,391,489,508.31 | 0.55% |
PYUSD | 869,097,812.41 | 0.35% |
USDX | 674,713,825.45 | 0.27% |
USDY | 601,998,548.59 | 0.24% |
Other | 6,843,229,460.95 | 2.73% |
Total | 251,098,989,565.00 | 100% |
Supply Breakdown and Percentages of Stablecoins by Project (July 2025) Source: Artemis
Circle is positioned as the second biggest stablecoin in the market, after Tether. The reason why it is considered in the category of legacy stablecoins is that it is one of the three biggest stablecoins. It also has a considerably bigger market share than the MakerDao (DAI and USDS) project that comes after it. The stablecoin market has a duopoly. That is, it is monopolized by two companies. These two companies are Tether and Circle. Together, their market capitalization accounts for 88% of the total market.

When we examine the market capitalization for the last 3 years, although Circle has increased its market capitalization, its rival Tether has increased more, and decreased Circle's percentage of the market. Circle, which had a 39.2% market share 3 years ago, has a 25.4% market share in May 2025. In contrast, its primary competitor, Tether's market share has increased from 55.8% to 66.9% after three years.

Perhaps the best thing Circle has done in the last 3 years is to establish various partnerships, allowing USDC to take the lead in trading volumes. If we analyze the last 3 years, except for the Silicon Valley Bank crisis in 2023, there has been a general growth in Circle's trading volumes. From time to time, this growth was so high that in December 2024, it realized 88% of USDC trading volumes in the weekly timeframe. Looking at May 2025 data, we can say that on average, USDC accounts for more than 50% of all stablecoin volumes.
Circle does not have a mechanism to share the revenue generated from the assets it holds as collateral with users. In various decentralized finance protocols, the returns offered by the protocol may be preferable.
The most important recent development about Circle is the company's IPO.
Since 2013, Circle has raised more than $1 billion in more than nine investment rounds. After a $400 million round in 2022, which included BlackRock and Fidelity, the last investment round was led by Coinbase in 2023 with the dissolution of the CENTRE Consortium. On June 4, 2025, Circle went public and started trading on the New York Stock Exchange (NYSE). On the day of the IPO, the value of its shares increased 2.5 times, reaching its actual valuation. While the IPO price was $31 per share, on June 7, the shares were trading at $115. The share value, which reached 3.7 times in 4 days, attracted the attention of many non-crypto investors. With this rise, the company's market capitalization reached $21.6 billion.
Just before the IPO, Ripple (XRP) had made an offer worth $4-5 billion to buy Circle. Circle management rejected the offer as too low. Considering that the valuation reached $21 billion with the IPO that immediately followed, the rejection of this offer becomes more meaningful.
The partnership, which was announced at Abu Dhabi Finance Week in December 2024, aims to increase the use and liquidity of USDC within Binance. Binance is also starting to use USDC as a digital asset for treasury management. Of course, a win-win situation emerged in March 2025 when European Union citizens could not use stablecoins such as USDT and FDUSD due to a lack of MiCA compatibility. Since Binance will inevitably ban stablecoins other than USDC to EU citizens, it has also teamed up with Circle to make this a win-win for both parties.
Circle may be one of the projects that will attract attention after the enactment of the GENIUS law, the stablecoin law in the US, which we previously shared with you as an article (Turkish). Circle, which already has a license from the European Union and an IPO in the US, seems to be adapting to the requirements of the upcoming law. Although the law has not been finalized, Circle, which complies with the current draft, is already very active in lobbying activities.
At the end of 2024, Stripe, a financial technology company, acquired Bridge, a crypto payment infrastructure provider, for 1.1 billion dollars. In this way, thousands of e-commerce merchants that Stripe provides payment infrastructure to have had the chance to receive payments with stablecoin. The stablecoin used by Bridge in these payments is USDC. As a result of this move, Circle started to appeal not only to people in the cryptocurrency ecosystem but also to the whole world. Moreover, the transaction fee rate, which is 2.9% on credit cards, is set at 1.5% for stablecoin payments. This provides an incentive for e-commerce merchants, in particular, to accept stablecoin payments.
MakerDAO is the latest stakeholder in the category of legacy stablecoins and is a project created by Rune Christensen in 2014. MakerDAO is a stablecoin that works with a Collateralized Debt Position (CDP) mechanism. DAI is the first decentralized stablecoin to emerge in 2017.
It's called decentralized because it doesn't have an issuer like Tether or Circle, which we've already looked at. You don't need anyone's permission to create this stablecoin, which is entirely governed by smart contracts (permissionless).
The risk parameters in these smart contracts are also managed by the community. MKR holders, who are the protocol tokens of MakerDAO, determine the principles of DAI creation through voting. Thus, there is no centralization even in the development of smart contracts. This highly decentralized project uses a decision-making method through this community, also known as a decentralized autonomous organization (DAO), in many decision-making stages.
As of September 2024, MakerDAO is in the process of being rebranded as Sky after a community vote. This was not only a rebranding, but also a change in the collateral mechanism of the decentralized stablecoin DAI. Unfortunately, we were unable to find a separate collateralization analysis for DAI and USDS, so our final collateralization breakdown will include the total value of both DAI and USDS.
To understand DAI's collateralization methodology, it is important to understand how collateralized debt positions (CDPs) work. This system is quite similar to the mortgage system in traditional finance. For example, you own a car worth 1 million Turkish Liras and you want to take out a loan by pledging it as collateral. Since your car is worth 1 million Turkish Liras, you can take out a loan for less than that.
Borrowing against collateral is very similar. Assuming you have 1 million Turkish Liras worth of Bitcoin, you can invest it in MakerDAO and create 500 thousand Turkish Liras worth of DAI in return. However, the important thing to note here is that if your initial deposit of 1 million Bitcoin drops to 675,000 Bitcoin, MakerDAO smart contracts will sell your Bitcoin to pay off the 500,000 DAI you borrowed.
These systems are called collateralized debt position (CDP) because you deposit collateral and creating a debt position in DAI in return.
When DAI was first created by MakerDAO, it could only be created with a single collateral, and that collateral was Ethereum. In 2019, it became possible to create DAI with multiple types of collateral. At first, in addition to ETH, WBTC, and tokens of various decentralized finance protocols could be used as collateral. Later, tokens that include staking revenue, such as stETH and lBTC, also became available as collateral. The most inefficient point of DAI is that the collateral ratio is 1.5 times the amount of DAI to be created. This is because the cryptocurrencies used as collateral are volatile assets. On the other hand, it is highly inefficient to use $150 worth of ETH in a protocol to create a $100 stablecoin. Capital inefficiency was one of the main problems of DAI.
Among DAI collateral, the most controversial asset is USDC. Added to the first-class collateral pool alongside ETH at the end of 2020, USDC's collateral ratio against DAI initially stood at 125% before being reduced to 103%. This sparked significant debate over the logic of backing DAI, which champions decentralization, with USDC, which has a centralized issuer. In 2022, Maker added short-term U.S. Treasury bills to the list of collateral assets for DAI to diversify its collateral pool. Additionally, various real-world assets, such as securities, have been added to the collateral pool in experimental pools.
USDC entered the first-class collateral pool in September 2020, and three months later, in December 2020, DAI's new module, the Peg Stability Module (PSM), went live. Thanks to this module, users can now exchange their DAI for USDC at a 1:1 ratio at any time. The module initially operated with a 1% transaction fee, which was later reduced to 0.1%, and finally became free of charge.
Not much has changed in terms of collateralization during the transition from DAI to USDS. DAI had already moved away from collateralizing only through crypto assets, accepting real-world assets such as US treasury bonds and stablecoins such as USDC as collateral. With the transition from DAI to USDS, the issue of DAI being a decentralized stablecoin, which has been at the center of controversy, has been clarified. The biggest difference between USDS and DAI was the presence of a freeze function within the contract. This highly debated development, which hindered the decentralization of USDS, was necessary both to freeze the assets obtained in possible future cyberattacks while in the hands of hackers and to comply with the regulations in the US.
You can view the total collateralization breakdown of USDS and DAI in the table below:
Collateral Asset | Percentage |
Spark Liquidity Layer (SLL) | 59.457% |
USDC (Peg Stability Module / PSM) | 26.443% |
Morpho Spark Vault | 3.990% |
ETH Low Fee (170% Margin Rate) | 3.919% |
ETH Balanced (145% Margin Rate) | 2.437% |
Gelato Network USDC-DAI Pool | 0.684% |
Other | 3.07% |
Total | 100% ($8,144,505,060) |
Breakdown of USDS and DAI's Total Collateral Assets (June 2025) Source: Makerburn
As we can see from the table above, the majority of collateral is managed by the Spark LiquidityLayer. Spark is the main decentralized finance protocol adopted by the Sky ecosystem. The SparkLiquidity Layer is a fund managed by Spark that invests liquidity in different decentralized finance protocols, real-world assets or crypto assets.
The breakdown of protocols and funds that Spark Liquidity Layer investments can be seen in the table below:
Invested Protocol or Fund | Percentage |
SparkLend | 22.37% |
BlackRock | 20.49% |
Morpho | 15.48% |
Ethena | 15.3% |
Centrifuge | 10.24% |
Superstate | 7.69% |
Maple | 5.76% |
Aave | 1.36% |
Peg Stability Module 3 (PSM3) | 1.14% |
Curve | 0.14% |
Fluid | 0.02% |
Total | 100% |
Breakdown of Protocols and Funds in which Spark Liquidirt Layer Invests Source: Spark
As can be seen above, the Spark Liquidity Layer not only invests and monetizes real-world assets through BlackRock but also diversifies its portfolio by investing in various decentralized finance protocols. It is worth noting that these funds or protocols are only invested in through stablecoins.
Even before Ethereum existed, the idea of a cryptocurrency pegged to the US dollar was being questioned. In 2015, with the emergence of Ethereum and thus smart contracts, the infrastructure for this USD-pegged cryptocurrency was in place. By 2017, technical improvements were made, whitepapers were written, and smart contracts were developed. The project is led by Rune Christensen, who is still the same person.
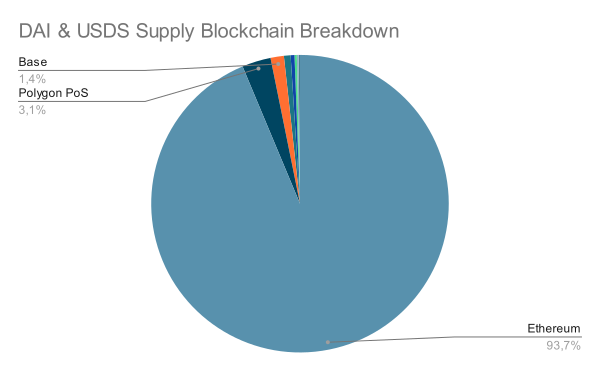
Blockchain | Supply | Percentage |
Ethereum | 8,100,000,000 | 93.69% |
Polygon PoS | 270,300,000 | 3.13% |
Base | 125,200,000 | 1.45% |
Solana | 62,900,000 | 0.73% |
BNB Chain | 35,800,000 | 0.41% |
Arbitrum | 21,800,000 | 0.25% |
Optimism | 17,600,000 | 0.20% |
Avalanche | 11,800,000 | 0.14 |
Total | 8,645,400,000 | 100% |
DAI & USDS Supply Breakdown by Blockchains Table Source: Artemis
As we can easily observe from the chart and table above, the overwhelming majority of the supply of DAI and USDS stablecoins is on the Ethereum blockchain. Although the transition from DAI to USDS was supported by the Solana blockchain, and early adopters of USDS on the Solana network received a weekly reward of $500,000, it is hard to say that it was very effective.
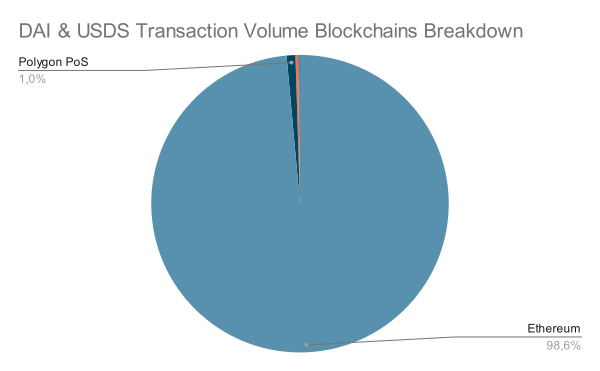
Blockchain | Volume | Percentage |
Ethereum | 103,400,000,000 | 98.55% |
Polygon PoS | 1,000,000,000 | 0.95% |
Solana | 306,900,000 | 0.29% |
Base | 86,000,000 | 0.08% |
Arbitrum | 83,600,000 | 0.08% |
Optimism | 22,000,000 | 0.02% |
BNB Chain | 14,400,000 | 0.01% |
Avalanche | 3,800,000 | 0.0004% |
Total | 104,916,700,000 | 100% |
DAI & USDS Transaction Volume Blockchain Breakdown Table Source: Artemis
When we examine transaction volumes, the difference we encounter does not surprise us. Considering that more than 90% of the supply is currently on the Ethereum network, it is not surprising that most of the volume is also there. The fact that the volume created on the BNB Chain and Avalanche blockchains exceeds the supply on those blockchains also indicates that stablecoins are in a fairly idle state.


When we look at the sectoral distribution, we see that almost all of the supply is in decentralized finance products. Similarly, we see that the majority of the trading volume is in decentralized finance transactions, with the rest being done by bots taking advantage of small arbitrage opportunities in blockchain transactions. This means that DAI and USDS are usually in users' wallets and actively traded, rather than on centralized exchanges.
You can view the entire market data in the chart and table below:
Stablecoin | Supply | Percentage |
USDT | 161,310,145,128.40 | 64.24% |
USDC | 61,805,458,863.36 | 24.61% |
DAI and USDS | 8,426,355,202.24 | 3.36% |
USDe | 5,502,376,876.23 | 2.19% |
USD1 | 2,211,713,093.08 | 0.88% |
USDtb | 1,452,411,245.98 | 0.58% |
FDUSD | 1,391,489,508.31 | 0.55% |
PYUSD | 869,097,812.41 | 0.35% |
USDX | 674,713,825.45 | 0.27% |
USDY | 601,998,548.59 | 0.24% |
Other | 6,843,229,460.95 | 2.73% |
Total | 251,098,989,565.00 | 100% |
Supply Breakdown and Percentages of Stablecoins by Project (July 2025) Source: Artemis
Although DAI and USDS exist as two different stablecoins after the branding move, since they are the same project, we have examined them together in the table and pie chart with a slight adjustment. When analyzed in this way, USDS and DAI, which rank third with a share of 3.36% of the market, occasionally change places with their close rival USDe.

When we look at the last 3 years of market share, it is observed that USDS and DAI have dropped from about 5% market share to around 3.5%. This is actually quite normal at a time when Tether is increasing its market share and stablecoins that generate revenue as a result of the algorithm, such as Ethena, are emerging.
USDS and DAI share the proceeds from the collateral they hold under the Sky Savings Rate. To do this, users need to go into the Sky ecosystem's app and convert their USDS into sUSDS (Savings USDS). This will allow it to benefit from an annualized return of 4.5%, displayed as of June 2025.
Although there has been no direct development from Sky, Spark protocol, the largest collateral provider for DAI and USDS, has launched its own governance token, SPK. SPK has a fairly simple token economy, with 65% of its total supply to be distributed as rewards to users in the Sky ecosystem over a period of 10 years. In fact, the fact that the Spark protocol is distributing its own token to all users within the Sky ecosystem further highlights the close collaboration between the two project teams.