

The hard part of crypto trend trading is not finding a trend. It is doing the same thing every time: holding while a rule says hold, selling the day it says sell, and not arguing with it because the news is loud or the chart looks oversold. Tideline is built around that one habit. One published rule, read the same way on 140 crypto assets, with every signal on a public record. One rule. Every signal. No emotions.
This article stands on its own. It covers why trend following suits people who are not traders, how the Tideline works, and why consistency, not cleverness, is what builds confidence in a trading rule.
Why trend trading suits people who are not traders
Crypto’s problem is not that it goes nowhere. It is how far it falls on the way. In the period Tideline studied, 2019 to 2026, a basket of the twenty most-traded crypto assets lost 85 percent of its value from peak to trough while still ending higher than it started. Most holders lived through some version of that fall, and most sold somewhere near the bottom or stopped looking.
Trend following is the plain answer to that problem. It does not predict. It responds. While an asset is above a line that follows its trend, you hold it. When it closes below, you move to cash and wait for the line to turn back up. The point is not to catch the top or the bottom. The point is to miss most of every large fall, and to pay for that with two known costs: missing part of every rebound, and taking small losses when a market goes sideways and the line flips back and forth.
Tideline’s rule was tested before it went live, with the wording of the result fixed before the numbers existed. The finding, in the words the study was allowed to use: in past data the rule had smaller falls; its return was similar overall and lower in recent years. The numbers behind that sentence: a worst fall of 46 percent against 85 percent for holding the same basket, and a yearly return of 42.5 percent against 38.5 percent. The costs are in the same study. Of 682 round trips, 58 percent lost money. The average winning trip made 49 percent and the average losing trip lost 14 percent; about one trip in five made more than 20 percent and paid for the rest. The longest run of losing trips was 17 in a row. In the four large falls of the period the rule avoided between 41 and 95 percent of the damage, and in the rebounds that followed it missed between 38 and 72 percent of the recovery so far.
That profile suits someone who is not a trader for a reason that has nothing to do with returns. The decisions are rare, mechanical and on a schedule. There is nothing to watch, nothing to interpret, and nothing to feel.
The Tideline system and how it works
The Tideline is not a secret indicator. It is the Supertrend indicator with period 10 and multiplier 3, which sits on every charting platform. Take each candle’s midpoint, move three average true ranges away from it, and you have a line that sits below price in an uptrend and only ratchets up, and above price in a downtrend and only ratchets down. When a candle closes on the other side, the direction flips. What Tideline adds is not a better line. It is the discipline around a plain one.
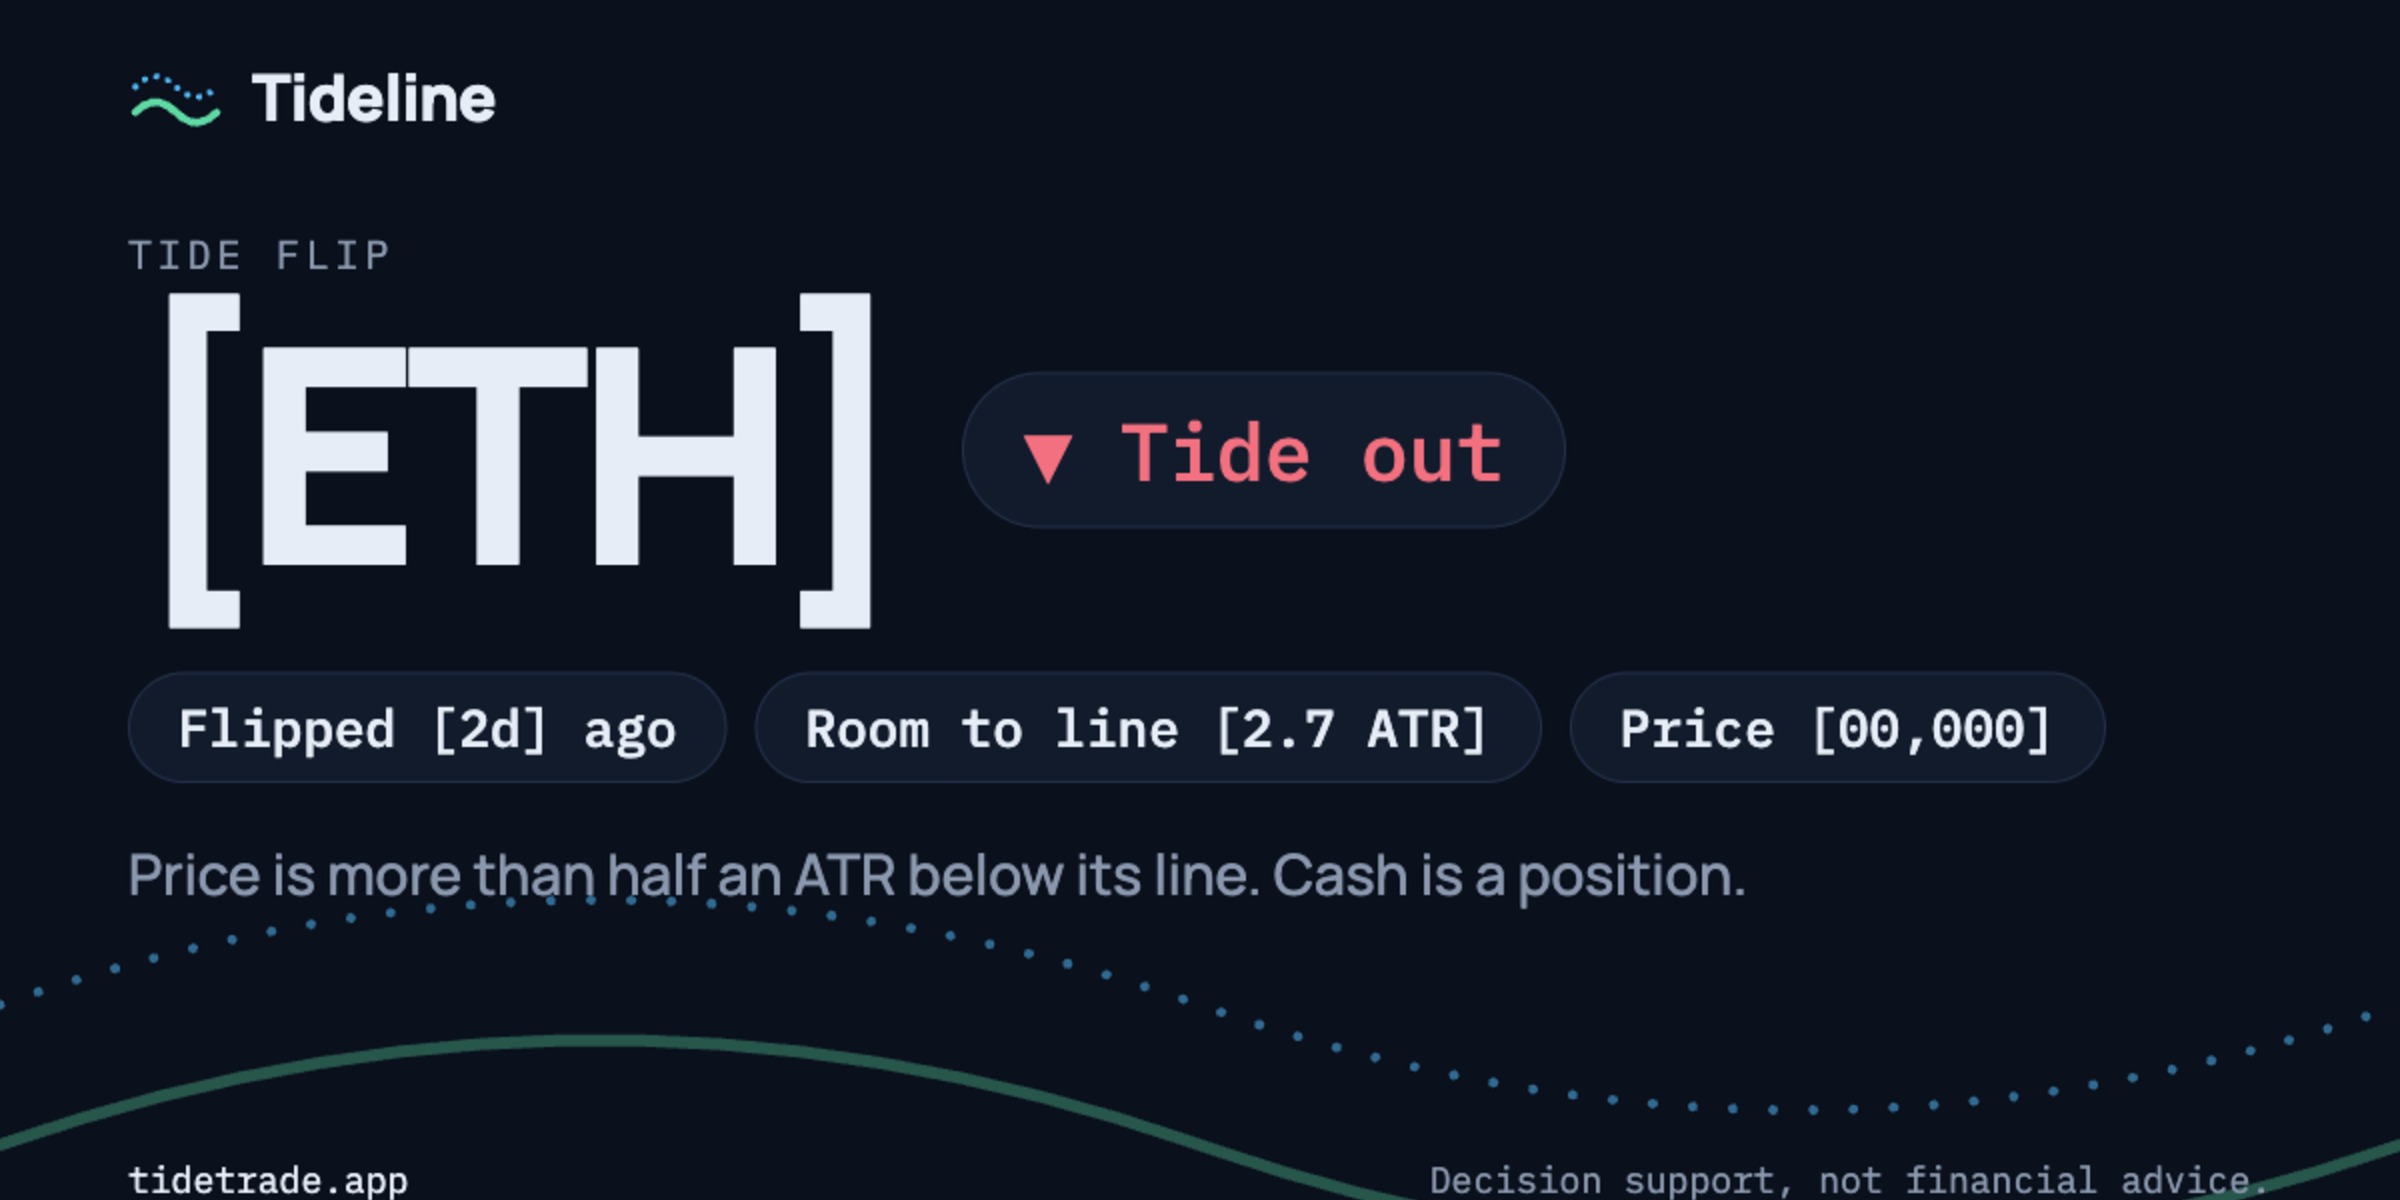
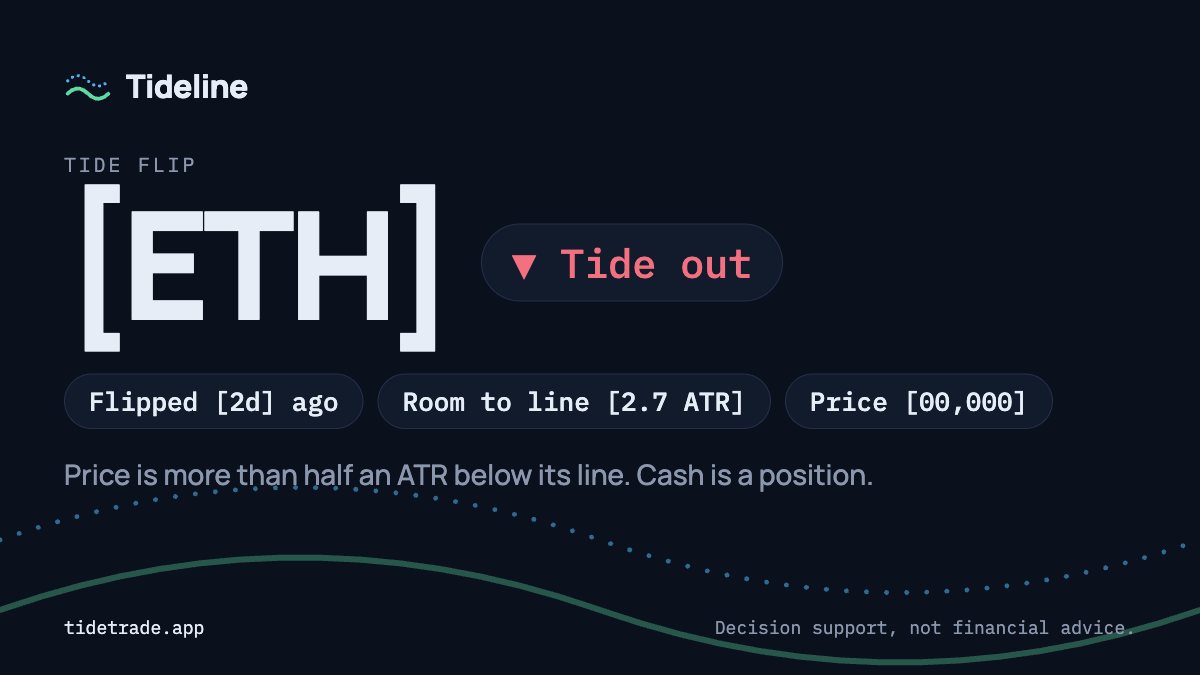
Three states. Above the line by more than half an ATR the tide is in: hold. Below it by more than half an ATR the tide is out: cash is a position. Within half an ATR of the line on either side is slack water, where the next candle could flip it. In slack water you do nothing new.
Completed candles only. A daily candle closes at midnight UTC. Tideline reads states and sends alerts only after the close, never on a candle still forming. On Tideline’s own data, about half of the flips that showed on a forming candle, 192 of 385, reversed before the candle ended. Reading early looks fast and is mostly noise.
The Tide Rules. Five sentences, on one page: hold only what is above its line; when the line flips, act and do not argue with it; in slack water, do nothing new; cap any one position; never borrow to hold a trend. Running them is just as short. Decide what share of your money the rule governs before you look at a chart. Split it equally across the Core assets whose tide is in, up to ten positions, and keep the rest in cash. When an alert says the tide went out, sell the next day. When it says the tide came in and you have room, buy the next day. Check on Sunday. Take every flip.
The record. Every flip for every asset is on a public ledger, labelled as replayed from history, observed live, observed late, or corrected. A hash of the whole ledger is published each day, so an edit would show. When a venue later revises a price, the stored row stays and a correction record sits beside it. The rule itself is versioned, and every change is written up in plain language.
What it is not. It does not forecast, does not set targets, does not short and does not use leverage. It is decision support, not advice. It shows the mechanical state of a published rule on completed candles, and nothing mo
Builds confidence
Confidence in a trading rule does not come from winning. It comes from knowing in advance what the rule will do and what it will cost, and then watching it do exactly that.
Consider what the study tells you before you start. The rule loses more often than it wins. The longest losing run on record is seventeen trips. About one trip in five pays for everything. If you know that going in, a run of six small losses is not a sign the method is broken. It is what the method looks like most of the time. The person who did not know that sells the rule at trip six and misses trip seven.
Consistency is also what makes the record useful. Because every flip is dated and public, you can compare what you did with what the rule said. Most people who lose money with a sound rule do not lose it on the rule. They lose it on the exceptions: the flip they skipped because the coin had “already fallen too far”, the position they held because a rebound “was obviously coming”. The ledger makes those exceptions visible, which is the first step to not making them.
Here is what consistency looked like this month, read from the ledger on 20 October 2026. On the candle of 13 October, 98 of the 140 assets Tideline follows were above their lines. By the candle of 19 October, 56 were. Between 8 and 18 October the rule moved sixty assets from tide in to tide out in six clusters of five or more on a single day. All sixty are still out. Four of the six clusters are below the price they left at, by one to three and a half percent at the median; the two most recent are about flat. Nobody knows whether this is the start of a long fall or a wobble before new highs. The rule did not need to know. It did the same thing sixty times, and if the tide comes back in it will do the opposite sixty times, a day late each way.
That phrase, a day late, matters for practice. Nothing needs to happen at midnight. The study replayed the rule acting one full day after each close: 41.5 percent a year with a worst fall of 49 percent, against 42.5 percent and 46 percent at the close. About a point of return and three of drawdown over seven years is the whole price of sleeping. So the routine is this. On Sunday, open the scanner or read the digest. When an alert arrives, act the next day. Keep positions equal. Never change the rule in the middle of a drawdown, because that is precisely when it is doing its job and when it feels worst.
Start here
-
The scanner at tidetrade.app shows all 140 assets, free, no account.
-
The wallet check shows which of your own holdings are below their lines: paste a public address, read-only.
-
How it works has the line and the three states; The Tide Rules has the five sentences and how to run them; the study has every benchmark and every weakness.
-
The free plan tracks your holdings and sends a Sunday digest. Pro, at $25 a month or $250 a year, sends an alert the night a flip happens, by email and Telegram.
-
The earlier post, “How to trend trade with the Tideline”, walks through the rules in more detail.
Questions people ask about crypto trend trading with the Tideline
Is the Tideline a prediction? No. It is the mechanical state of a published rule on completed candles. It says where price is relative to its trend line today, not where it will be tomorrow.
Which indicator is the Tideline? Supertrend with period 10 and multiplier 3, with ATR(10) for both the line and the slack-water band. The same indicator anyone can add to a chart; Tideline applies it the same way to every asset and keeps the record.
Why read completed candles only? Because about half of the flips seen on a forming candle reverse before it ends. The rule is read after the close, and acting the next day costs about a point of return and three of drawdown in past data.
Does crypto trend trading guarantee profits? No rule can. In the study 58 percent of round trips lost money, the longest losing run was 17, and the finding was smaller falls with a similar return overall and a lower one in recent years. Cryptoassets can lose most of their value.
Join us: https://tidetrade.app/
Follow us: https://linktr.ee/tidetrade
Tideline is decision support, not financial advice. Cryptoassets are high-risk; trend rules lose money in sideways markets and past states do not predict future prices. Every figure above comes from the published, pre-registered study at tidetrade.app/study/rule-v1-crypto or from the public ledger as of 20 October 2026.