

Most people who buy crypto have no exit plan. They have a thesis, a Twitter feed and a feeling. When the price falls 30 %, the thesis gets stronger and the feeling gets worse, and the exit happens at the bottom, if at all.
Trend trading is the opposite habit. You hold an asset while its price is above a line, and you hold cash while it is below. You do not predict. You do not argue. You act on the line, and the line is published.
This is how to do it with the Tideline, start to finish. There is less to it than you expect, and the hard part is not the maths.
One line, one rule
The Tideline is the Supertrend indicator with period 10 and multiplier 3, a rule from the early 2000s that exists on every charting platform. Take each daily candle’s midpoint, move three average true ranges away from it, and you have a line that sits below price in an uptrend and above it in a downtrend. When a candle closes on the other side, the direction flips.
That is the whole signal. Above the line, the tide is in. Below it, the tide is out. Within half an average true range of it, slack water, where the next candle could go either way.
Tideline applies the rule the same way to 140 crypto assets on completed candles only, records every flip in a ledger nobody can edit, publishes a daily hash of that ledger, and changes the rule only in public with a version number and notice. The point is not that the rule is clever. The point is that it is fixed, so you cannot talk yourself out of it at 2 a.m.
What it did, honestly
Before you follow a rule with real money you should know what following it felt like. Here is the past, in the study’s own words: in past data the rule had smaller falls; its return was similar overall and lower in recent years.
On a basket of the twenty most-traded crypto assets, rebuilt each quarter so it never knows the future:
- Worst fall: −46 %, against −85 % for holding the same basket.
- Return: 42.5 % a year, against 38.5 %. That difference is not statistically distinguishable from zero. The drawdown difference is.
- Four big Bitcoin drawdowns since 2019. The rule avoided 95 %, 41 %, 49 % and 69 % of each fall. It also missed 72 %, 49 %, 46 % and 38 % to date of each rebound.
Read the last line twice. You are not buying extra return. You are buying a smoother journey, and the price of it is that you will miss roughly half of every recovery because the rule re-enters late. People who do not know this in advance quit at exactly the wrong moment.
Step one: decide how much, before you look at a chart
Decide what share of your money this rule governs. Not of your crypto, of your money. Write the number down.
Then size positions the way the study did, because that is the only way we have evidence for: equal weight. Split the governed amount equally across the Core assets whose tide is in, up to ten positions. Whatever is not in a position is cash, and cash is a position, not a failure.
Equal weight does two things without any further rules. It caps any one holding by arithmetic, and it caps how many correlated bets you hold, because the position count is the cap. If twelve assets are tide in and your limit is ten, you hold the ten you already own or, starting fresh, the ten with the most room to their line. You do not need a view on which is “best”.
Step two: take every flip
The study’s 682 round trips are the most useful numbers it contains:
- 58 % lost money.
- The average winner made +49 %; the average loser lost −14 %.
- About one trip in five made 20 % or more, and one in ten made 50 % or more. Those trips are where all the return comes from.
- The longest run of losing trips in a row was 17.
- 12 % of trips were whipsaws, closed at a loss within ten days.
Put those together and the instruction writes itself. Most trips are small losses. A few are large wins. Nobody can tell in advance which flip is which. So a trend trader takes every flip, and a trend trader who skips the ones that “look wrong” is choosing which fifth of the trips to miss. After a run of six losers you will want to skip the seventh. That is the moment the system is for.
Step three: the next day is fine
Daily candles close at midnight UTC. Tideline reads them and sends alerts only after the close, never on a forming candle, because about half of the flips you see during the day reverse before it ends.
You do not need to act at midnight. The study measured acting one full day late: 41.5 % a year and a −49 % worst fall, against 42.5 % and −46 % for acting at the close. Over seven years, a day’s delay cost about one point of return and three points of drawdown. So the rule for a person with a job is simple: when the alert says the tide went out, sell the next day. When it says the tide came in, buy the next day. No urgency, no midnight trading, no chasing.
Step four: what to do in each state
- Tide in, you hold it: hold. Do not add beyond your equal-weight share.
- Tide in, you do not hold it: eligible to buy at the next day’s prices, within your position limit.
- Slack water, you hold it: hold, do not add. The line may flip next candle; let it.
- Slack water, you do not hold it: do nothing new.
- Tide out, you hold it: sell the next day. You will sometimes sell the low. The study shows you will also sometimes sell 40 % above the low, and that second case is the one that keeps you solvent.
- Tide out, you do not hold it: stay out.
Six lines. There is no seventh for “but the news”.
Step five: check on Sunday
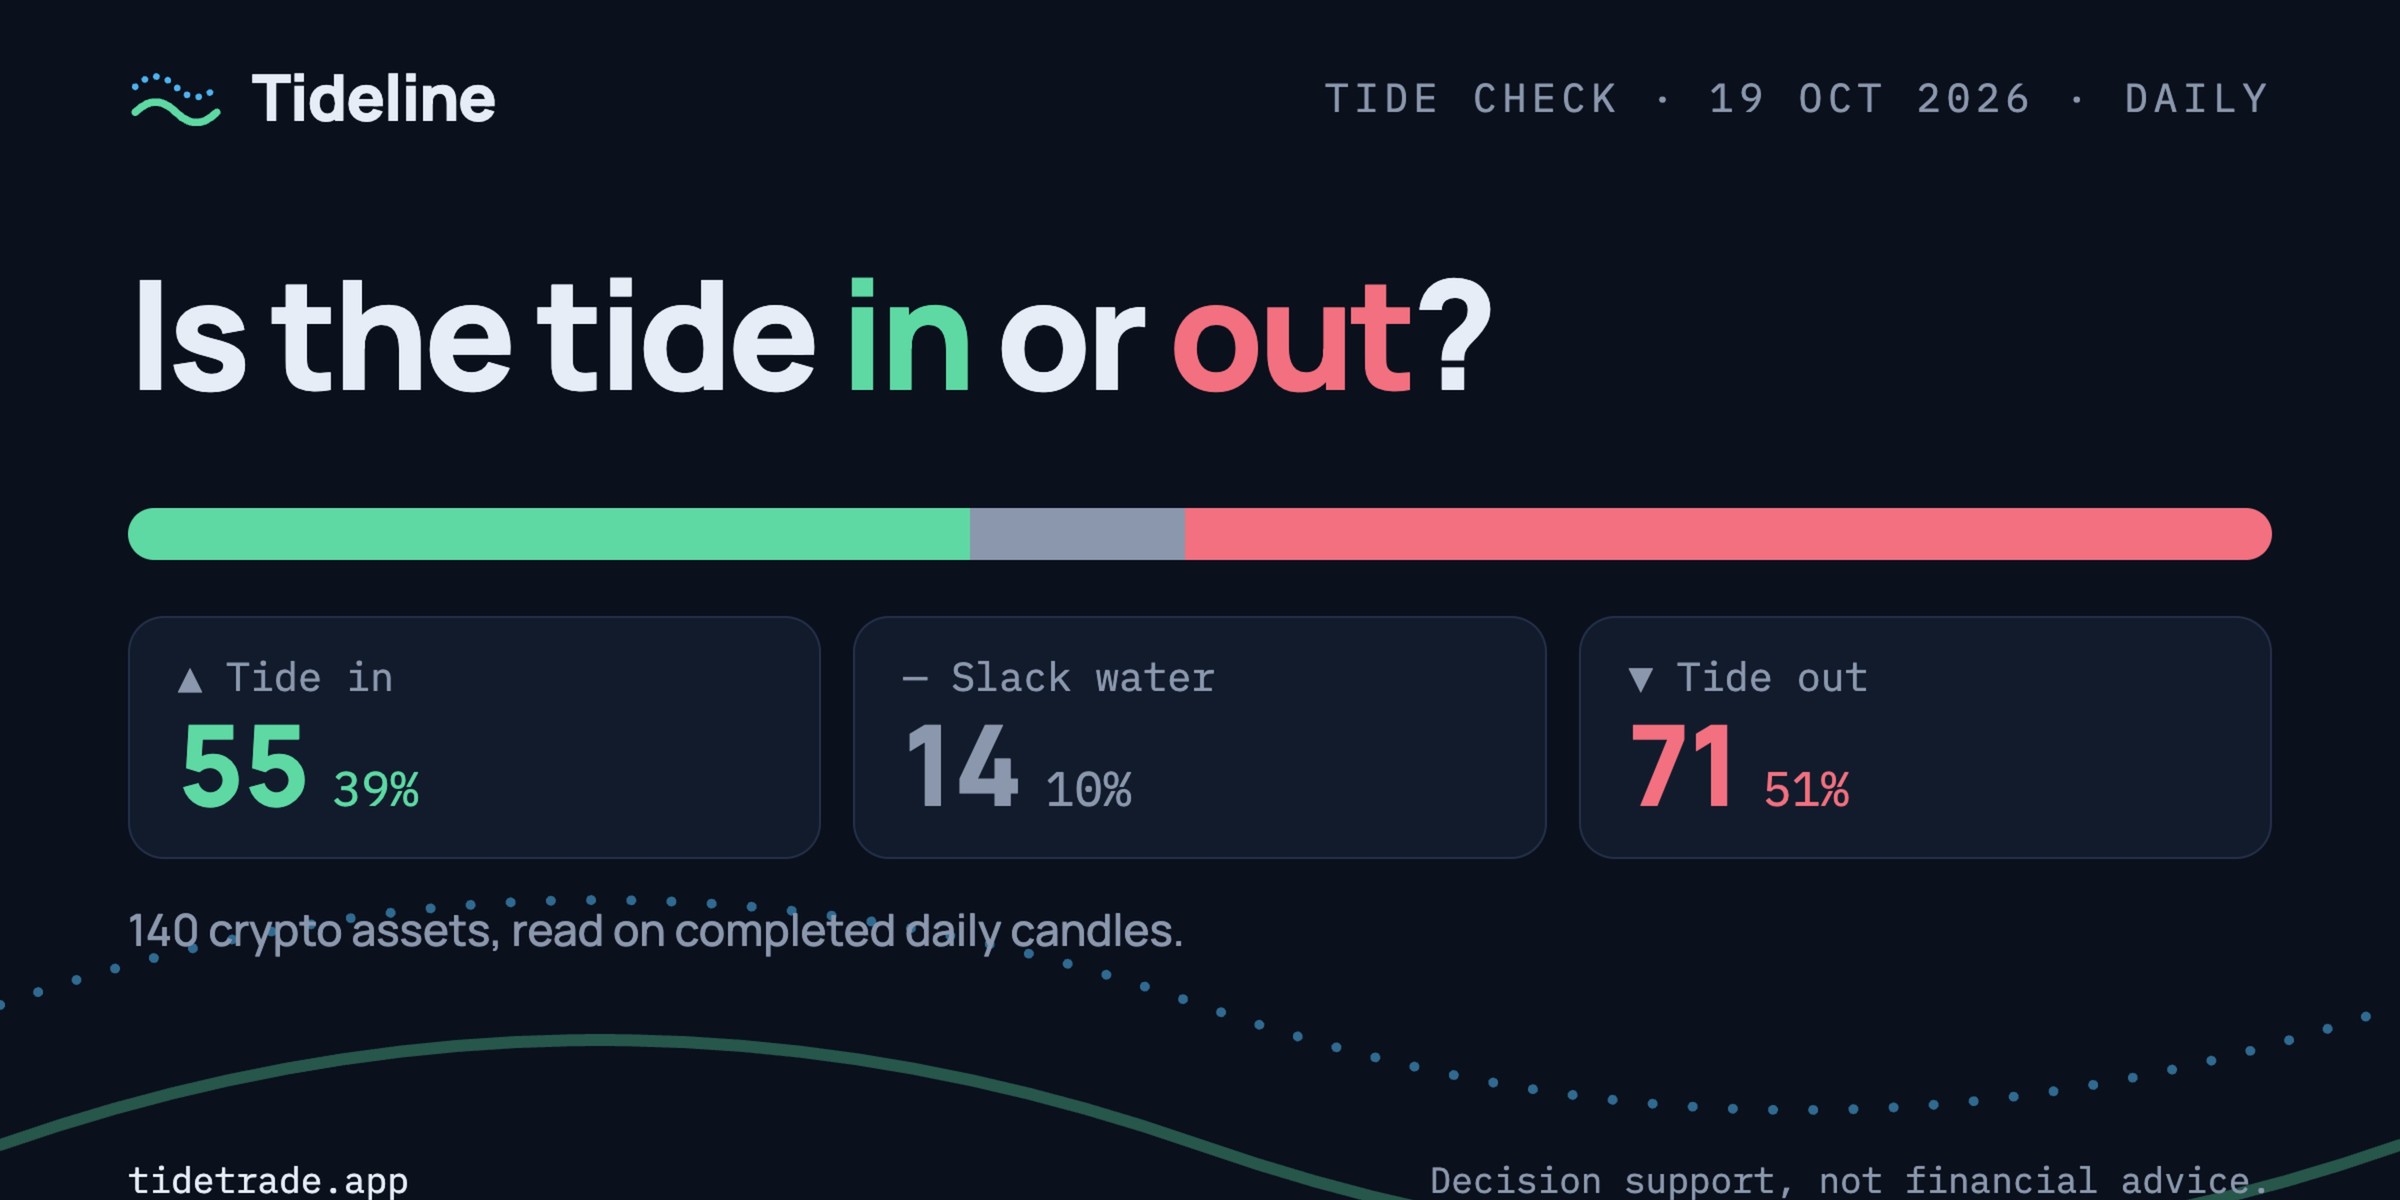
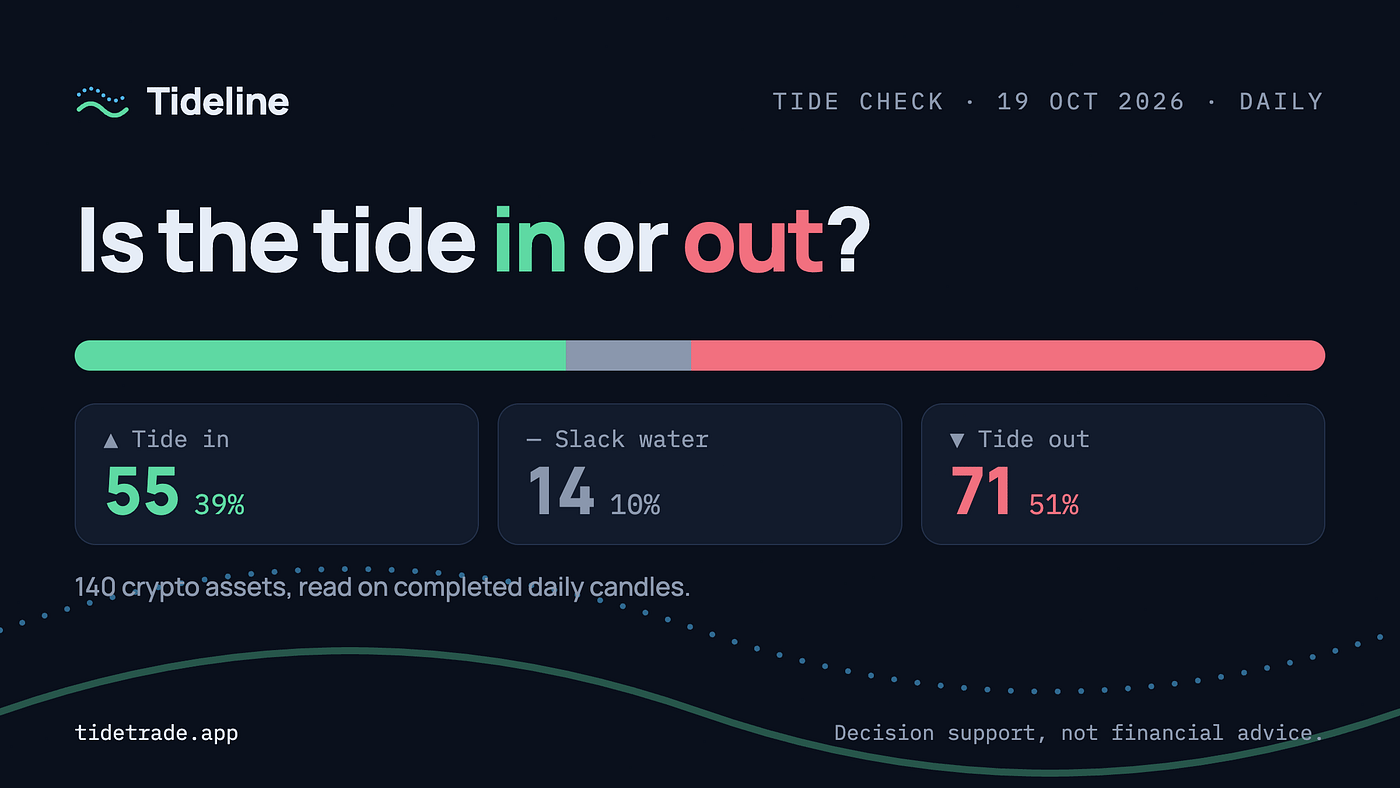
Once a week is enough. Breadth tells you the weather: today 98 of 140 crypto assets are tide in, 12 in slack water, 30 out. Your holdings against their lines tell you whether anything needs doing. A free Tideline account sends this on Sunday; a paid one also tells you the night a flip happens. Neither sends anything during the day, by design.
What this will feel like
In a sideways market this rule flips often and loses a little each time. You will have months where buy-and-hold beat you and a friend who ignored every signal did better. The study’s worst six months against the basket was a 458-point shortfall, in late 2020, while the market went vertical and the rule kept getting shaken out and re-entering late.
Then a fall comes. In 2022 the basket lost 81 % from peak to trough. The rule lost 41 %. In 2020, the basket lost 54 % in a month; the rule lost 3 %. You do not get the second kind of outcome without sitting through the first kind.
Trend trading is a trade: you give up some of the best months to avoid most of the worst ones. The rule makes the trade. The system is just you, keeping
a Telegram group, not an AI summary, not us. Those can explain, challenge and inform. They cannot decide. If something you read makes you want to buy or sell against the line, that is the moment to close the tab and reread the ledger.
Where to start
The scanner at tidetrade.app shows every asset’s state for free, read on completed candles. The study page shows every number above and every weakness we found. The ledger shows every flip, including the ones that lost. Paste a public wallet address and see your own holdings against their lines without connecting anything.
Pick a share of your money. Split it equally across what is tide in. Take every flip, the next day. Check on Sunday. That is the whole method, and the only skill it needs is the one the rule exists to replace: deciding in a calm moment what you will do in a loud one.
— -
Join us here: https://tidetrade.app/
Tideline is decision support, not financial advice. The numbers above describe the past on a specific basket with specific costs; they are not a forecast. Read the study’s limitations before you rely on any of them.