

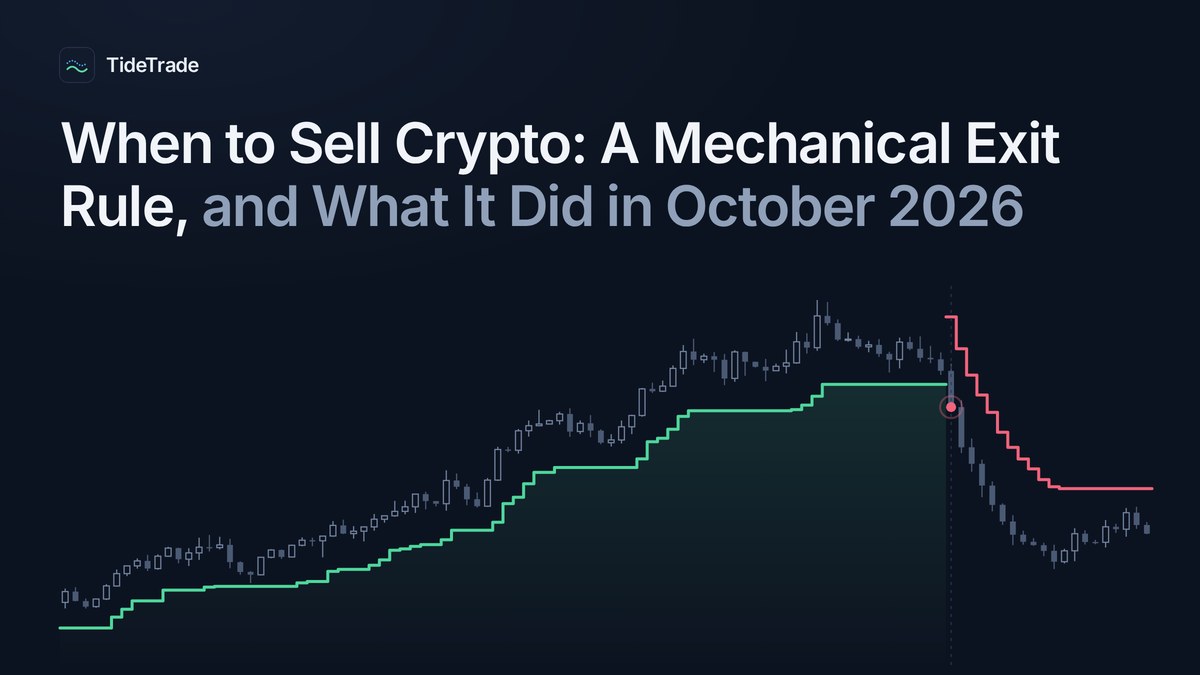
The short answer: nobody times the top, so the useful question isn’t “when will the market peak?” but “what would make me sell?” A mechanical exit rule answers it in advance. This article explains one such rule (Supertrend with period 10 and multiplier 3), shows what it did in October 2026, and is honest about what it costs.
Why is it so hard to know when to sell crypto?
Ask ten crypto holders what to buy and you get ten confident answers. Ask when they’ll sell and the room goes quiet. “When it doubles.” “When I’m back to even.” “I’m holding long term.” Those aren’t plans. They’re how a portfolio can be up 60% in spring and down 40% by autumn.
Selling is the hard half of trading, and the reason has nothing to do with charts. A sale is a decision you make while losing money, against a position you chose, with a voice in your head saying it will come back. Most people never make it. The ones who do usually make it late, in one panic, at the bottom.
The alternative needs no courage because it needs no decision: a crypto exit strategy fixed in advance, read the same way every day, that tells you when the trend has turned.
What is a mechanical crypto exit rule?
The rule is the Supertrend indicator with period 10 and multiplier 3, read on completed daily candles. It draws one line under a rising market and over a falling one. Each day, take the candle’s midpoint and move three average true ranges (ATR, over ten days) away from it.
-
While the trend is up, the line sits below price and only moves up.
-
While the trend is down, it sits above price and only moves down.
-
When a daily candle closes on the other side of the line, the direction flips.
TideTrade applies that line to 140 crypto assets. It’s mechanical, so there’s nothing to decide on the day. It reads completed candles only, so it never asks you to act on a price that might reverse by midnight. And it’s published, parameters and data sources included, so anyone can check what it said and when. Read the rule.
What do tide in, slack water and tide out mean?
-
Tide in: the close is more than half an ATR above the line. The rule says hold.
-
Slack water: the close is within half an ATR of the line, either side. The next candle could flip it. Do nothing new.
-
Tide out: the close is more than half an ATR below the line. The rule says cash. Cash is a position.
What did the rule do in October 2026?
Every flip below is on the public ledger, which is append-only and hashed daily. The exits came in clusters, each on a single daily candle:
-
8 October: 8 coins flipped out
-
12 October: 12
-
14 October: 12
-
16 October: 6
-
17 October: 12
-
18 October: 11
-
23 October: 6
-
24 October: 5
-
29 October: 20, Bitcoin among them
In all, October’s daily candles produced 120 exits across 119 coins, and 4 entries. By the 1 November candle, 120 of the 140 crypto assets were below their line and 14 above. The Sunday Tide Report for the week ending 1 November records 28 exits and 3 entries on the week’s candles, kept as written with the day’s ledger hash.
What happened after the exits?
Measured on the 1 November candle against each coin’s price on the day it flipped out:
-
8 October exits: median 3% below their exit price, 5 of 8 lower
-
12 October: 9.5% below, 10 of 12 lower
-
14 October: 10.7% below, all 12 lower
-
16 October: 14.9% below, all 6 lower
-
17 October: 12% below, all 12 lower
-
18 October: 8.4% below, 10 of 11 lower
-
23 October: 9.7% below, 5 of 6 lower
-
24 October: 6.9% below, 4 of 5 lower
-
29 October: 3.1% above their exit price, only 2 of 20 lower
Read the last line twice, because it’s the honest part. The twenty coins that flipped out on 29 October, Bitcoin included, were trading above their exit prices three days later. If the bounce holds, those were bad exits, and the rule will buy back in later and higher. That’s a whipsaw, and a trend rule pays that price regularly. The eight earlier clusters, 72 exits, show the other side: they got out one to three weeks before the market fell a further 7 to 15%, and on 1 November 70 of the 72 were still out.
When to sell Bitcoin: what did the rule say?
Bitcoin is a fair example of both sides. The rule had it tide in from 21 July, a trip of 100 days and about 17%. On 29 October the daily candle closed at $77,800, more than three ATR below a line that had been under price for a hundred days, and the state changed to tide out. On the 1 November candle it closed at $78,239, 6.6% below its line, still out. Whether that exit was early or right will be known in a few weeks. What’s already known is that it was made by the rule, on a completed candle, on the record, and not by anyone’s nerve.
What does selling by rule cost?
A rule that sells into every real downtrend also sells into every fake one. The costs are the numbers.
The rule was tested before the live record began, in a pre-registered study on the twenty most-traded crypto assets from January 2019 to October 2026, long or cash, with trading costs included. The study’s own one-sentence verdict: “In past data the rule had smaller falls; its return was similar overall and lower in recent years.”
-
682 trips, and 58% of them lost money. The average losing trip gave back 14%. The average winning trip made 49%. The rule makes its money on the few trends it rides to the end, and pays for them with many small losses.
-
The longest run of losing trips in a row was 17. Anyone following the rule would have sat through seventeen consecutive small losses at some point. Most people quit around the fifth.
-
The worst fall was 46%, against 85% for holding the same basket. In 2022 the rule lost 34% while holding lost 76%. That’s the whole case for an exit rule: it doesn’t avoid losses, it caps the size of the fall.
-
Returns were similar, not better. About 42% a year against 38% for holding over the whole period, and worse than holding in the last two years. If you expect an exit rule to make you richer in a bull market, it won’t. It’s there for the other kind of market.
Nothing in that list is a sales pitch, and that’s the point. A rule you can follow through seventeen straight losses has to be one whose costs you accepted before the first one.
Why does the rule only read completed candles?
Acting on a candle that hasn’t closed is where most people break a rule they meant to keep. Crypto never sleeps, so at any hour a coin can be “below its line” on the forming daily candle.
TideTrade reads its own data at 22:00 UTC every night and scores what happens by the close. Over the last two weeks, 45 of the 52 coins that were in play at 22:00 did flip by midnight, and every one of the 15 that were more than 4% past the line did. But across the longer record, 192 of 385 flips seen on a forming candle reversed before the candle ended. Half. The rule exists to take the decision out of your hands, and reading it early puts the decision straight back.
So the rule is read once, after the close, and the action is taken the next day. The study replayed exactly that: acting one full day after each close returned 41.5% a year with a worst fall of 49%, against 42.5% and 46% at the close. A day late costs little. A day early costs the rule.
How do you follow the rule yourself?
You don’t need TideTrade to follow it. It’s five lines, published as the Tide Rules:
-
Hold only what is above its line. Tide in means hold, tide out means cash, slack water means do nothing new.
-
Act the day after a flip, never on a forming candle.
-
Equal weight across whatever is in.
-
At most ten positions. The rest is cash, and cash is a position.
-
No overrides. The rule is wrong often. It’s still the rule.
On TradingView, add Supertrend with period 10 and multiplier 3 to a daily chart and read it after the close. Or use the free TideTrade scanner, which reads all 140 assets every night and shows each one’s state, its distance from the line in ATR, and the date of its last flip. If you hold coins already, the wallet check takes any public address, read-only, no account and nothing to connect, and tells you which of your holdings are below their line tonight.
Follow the record together
A rule is easier to keep when other people are reading the same record.
-
Telegram group: the daily tide is posted after every completed candle: how many of the 140 are in, in slack water and out, and every flip by name. The Sunday Tide Report goes in with its hash. Nobody is told what to buy, nothing is sold, and anyone posting price targets or paid signals is removed. It’s free and needs no account: t.me/tidetradeapp.
-
Sunday Tide Report by email: one email each Sunday with the week’s tide, every flip, and the record behind it. Every edition is kept in the archive as written.
-
Elsewhere: the daily numbers are also posted on Bluesky, and every channel is at linktr.ee/tidetrade.
FAQ
When should I sell my crypto?
There’s no universal answer. A rule-based approach means deciding the conditions in advance, such as “I exit when the rule turns tide out,” and following them.
What is Supertrend in crypto?
A trend-following indicator that plots a volatility-adjusted line above or below price. Price closing above signals an uptrend, and closing below signals a downtrend.
Does a mechanical exit rule beat buy-and-hold?
Not necessarily. In the study, returns were similar overall and lower in recent years, but the falls were smaller.
Does Supertrend work in sideways markets?
Poorly. Whipsaws are the known cost of any trend rule.
The one thing to take away
You won’t time the top, and neither will anyone selling you a way to. What you can do is decide today, in calm, what would make you sell, write it down, and then do it when the day comes. The Supertrend line is one good answer to “what would make you sell.” The October record shows it working and shows it costing, in the same month, on the same page. That’s what an honest exit rule looks like.
TideTrade is decision support, not financial advice. It reports the mechanical state of a published rule on completed candles and forecasts nothing. Trend rules lose money in sideways markets, and the linked study says how much. Cryptoassets are high-risk. Indices and commodities on the site are an alpha and not for decisions.